Python 生成曲线进行快速平滑处理
前言
在编写测试程序的时候,由于数据帧数多的原因,导致生成的曲线图比较难看,如下图:
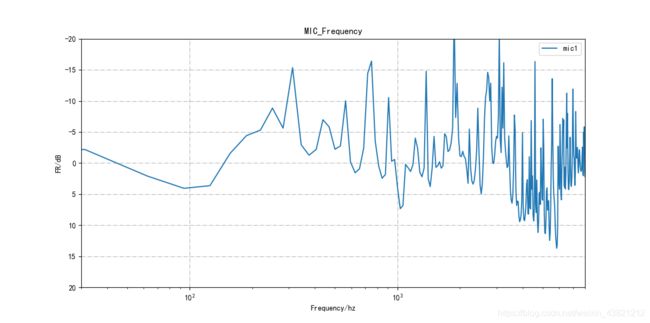
由于高频某些点的波动导致高频曲线非常难看,因此需要对曲线做平滑处理,让曲线过渡更平滑。对曲线进行平滑处理,这里推荐使用Savitzky-Golay 滤波器,可以在scipy库里直接调用,不需要再定义函数。
Savitzky-Golay 滤波器
关于Savitzky-Golay 滤波器,可以在scipy里看到关于这个函数的定义:
https://docs.scipy.org/doc/scipy/reference/generated/scipy.signal.savgol_filter.html
Savitzky-Golay平滑滤波是光谱预处理中常用滤波方法,它的核心思想是对一定长度窗口内的数据点进行k阶多项式拟合,从而得到拟合后的结果。对它进行离散化处理后后,S-G 滤波其实是一种移动窗口的加权平均算法,但是其加权系数不是简单的常数窗口,而是通过在滑动窗口内对给定高阶多项式的最小二乘拟合得出。
Savitzky-Golay平滑滤波被广泛地运用于数据流平滑除噪,是一种在时域内基于局域多项式最小二乘法拟合的滤波方法。这种滤波器最大的特点在于在滤除噪声的同时可以确保信号的形状、宽度不变。
使用平滑滤波器对信号滤波时,实际上是拟合了信号中的低频成分,而将高频成分平滑出去了。如果噪声在高频端,那么滤波的结果就是去除了噪声,反之,若噪声在低频段,那么滤波的结果就是留下了噪声。
总之,平滑滤波是光谱分析中常用的预处理方法之一。用Savitzky-Golay方法进行平滑滤波,可以提高光谱的平滑性,并降低噪音的干扰。S-G平滑滤波的效果,随着选取窗宽不同而不同,可以满足多种不同场合的需求。
代码实现
python中Savitzky-Golay滤波器调用如下:
tmp_smooth = scipy.signal.savgol_filter(tmp,53,3)
其中,在scipy的解释中,
scipy.signal.savgol_filter(x, window_length, polyorder, deriv=0, delta=1.0, axis=-1, mode=‘interp’, cval=0.0)[source]
Apply a Savitzky-Golay filter to an array.
This is a 1-d filter. If x has dimension greater than 1, axis determines the axis along which the filter is applied.
Parameters
xarray_like
The data to be filtered. If x is not a single or double precision floating point array, it will be converted to type numpy.float64 before filtering.
window_length:int
The length of the filter window (i.e. the number of coefficients). window_length must be a positive odd integer. If mode is ‘interp’, window_length must be less than or equal to the size of x.
polyorder:int
The order of the polynomial used to fit the samples. polyorder must be less than window_length.
x为原始数据,即我上面代码中的tmp数据。window_length是窗口长度,该值需为正奇整数。polyorder为对窗口内的数据点进行k阶多项式拟合,k的值需要小于window_length。
现在看一下window_length和k这两个值对曲线的影响。
首先是window_length对曲线的平滑作用,代码如下:
tmp_smooth1 = scipy.signal.savgol_filter(tmp,21,3)
tmp_smooth2 = scipy.signal.savgol_filter(tmp,53,3)
plt.semilogx(f,tmp*0.5,label = 'mic'+str(num+1))
plt.semilogx(f,tmp_smooth1*0.5,label = 'mic'+str(num+1)+'拟合曲线-21',color = 'red')
plt.semilogx(f,tmp_smooth2*0.5,label = 'mic'+str(num+1)+'拟合曲线-53',color = 'green')
生成曲线图如下:
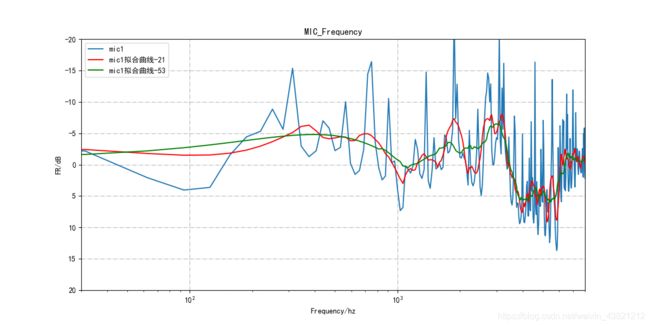
可以看到,window_length的值越小,曲线越贴近真实曲线;window_length值越大,平滑效果越厉害。
再看k值对曲线的影响,代码如下:
tmp_smooth1 = scipy.signal.savgol_filter(tmp,53,3)
tmp_smooth2 = scipy.signal.savgol_filter(tmp,53,9)
plt.semilogx(f,tmp*0.5,label = 'mic'+str(num+1))
plt.semilogx(f,tmp_smooth1*0.5,label = 'mic'+str(num+1)+'拟合曲线-P3',color = 'red')
plt.semilogx(f,tmp_smooth2*0.5,label = 'mic'+str(num+1)+'拟合曲线-P9',color = 'green')
生成曲线图如下:
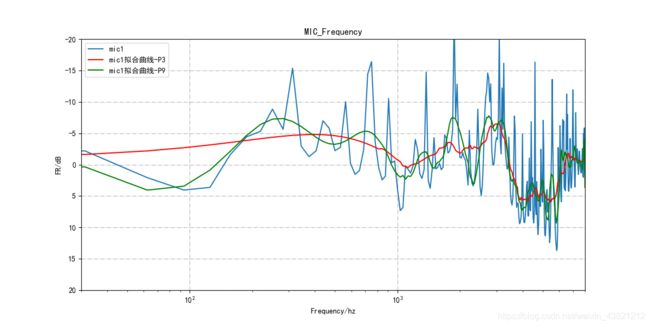
可以看到,k值越大,曲线越贴近真实曲线;k值越小,曲线平滑越厉害。另外,当k值较大时,受窗口长度限制,拟合会出现问题,高频曲线会变成直线,如下图所示:
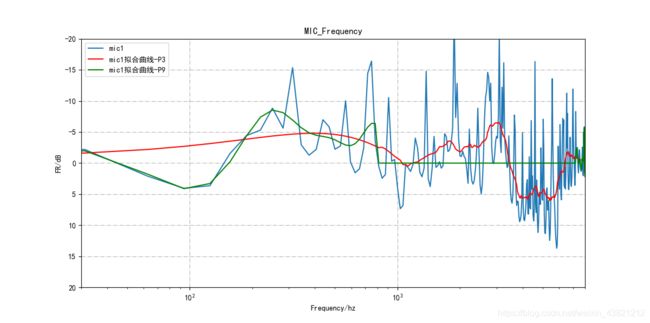
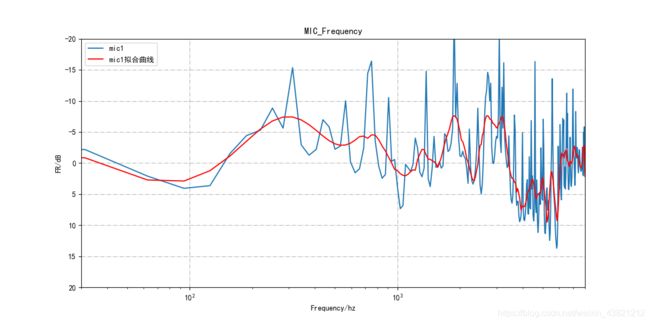
最终调整阈值得到的拟合效果如下:
相关参考链接:
Savitzky-Golay平滑滤波的python实现