可视化|东京奥运会可视化(二)
文章目录
-
- 3.2 运动员可视化
-
-
- 3.2.1 数量可视化
-
- 1. 按国家奥委会聚合矩形树图
- 2. 按赛事类型聚合矩形树图
- 3.2.2 地理可视化
-
- 1. 各国运动员分布地图
- 3.2.3 比例可视化
-
- 1. 各国主要项目参赛运动员比例
-
- 3.3 国家奥委会可视化
-
-
- 3.3.1 比例可视化
-
- 1. 东京奥运会参赛国家获奖比例水滴图
- 2. 东京奥运会参赛国家获奖比例饼图
- 3. 东京奥运会参赛国家获奖比例组合图
-
上篇博文【可视化|东京奥运会可视化(一)】中分享了东京奥运会奖牌榜可视化,下面我们继续介绍运动员可视化与国家奥委会可视化。
3.2 运动员可视化
3.2.1 数量可视化
1. 按国家奥委会聚合矩形树图
此处的矩形树图学习自另一个作者的可视化文章,但笔者暂时找不到当时那篇博文,等我找到后再补上原文链接!!!
# [可视化]按国家统计运动员数量
from pyecharts.charts import TreeMap
from pyecharts import options as opts
import pandas as pd
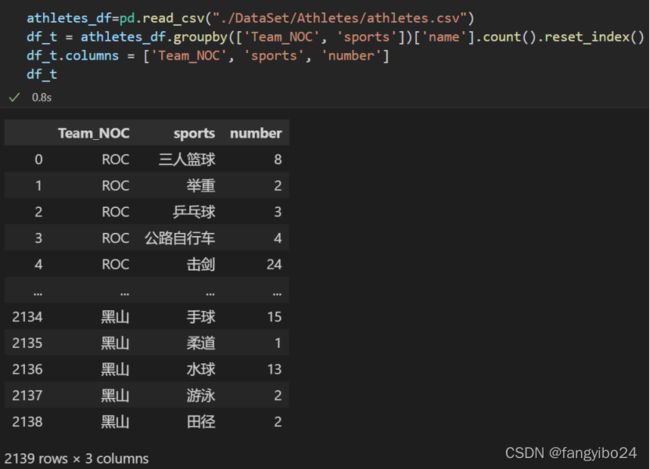
athletes_df=pd.read_csv("./DataSet/Athletes/athletes.csv")
df_t = athletes_df.groupby(['Team_NOC', 'sports'])['name'].count().reset_index()
df_t.columns = ['国家奥委会', '赛事', '人数']
data = []
country = []
for idx, row in df_t.iterrows():
if row['国家奥委会'] in country:
data[-1]['children'].append(dict(name=row['赛事'], value=row['人数']))
else:
data.append(dict(name=row['国家奥委会'], children=[dict(name=row['赛事'], value=row['人数'])]))
country.append(row['国家奥委会'])
treemap = TreeMap(
init_opts=opts.InitOpts(
theme='light',
width='1000px',
height='600px',
# bg_color='rgb(0,0,0)'
))
treemap.add(
"参赛人数",
data,
leaf_depth=1,
label_opts=opts.LabelOpts(position="inside", formatter='{b}:{c}名'),
levels=[
opts.TreeMapLevelsOpts(
treemap_itemstyle_opts=opts.TreeMapItemStyleOpts(
border_color="#555", border_width=4, gap_width=4
)
),
opts.TreeMapLevelsOpts(
color_saturation=[0.3, 0.6],
treemap_itemstyle_opts=opts.TreeMapItemStyleOpts(
border_color_saturation=0.7, gap_width=2, border_width=2
),
),
opts.TreeMapLevelsOpts(
color_saturation=[0.3, 0.5],
treemap_itemstyle_opts=opts.TreeMapItemStyleOpts(
border_color_saturation=0.6, gap_width=1
),
),
# opts.TreeMapLevelsOpts(color_saturation=[0.3, 0.5]),
],
)
treemap.set_global_opts(
title_opts=opts.TitleOpts(title="2020东京奥运会参赛人数统计(国家/地区)", pos_left='center', title_textstyle_opts=opts.TextStyleOpts(font_size=20)),
legend_opts=opts.LegendOpts(is_show=False)
)
treemap.render('./Visual/运动员数量[国家].html')
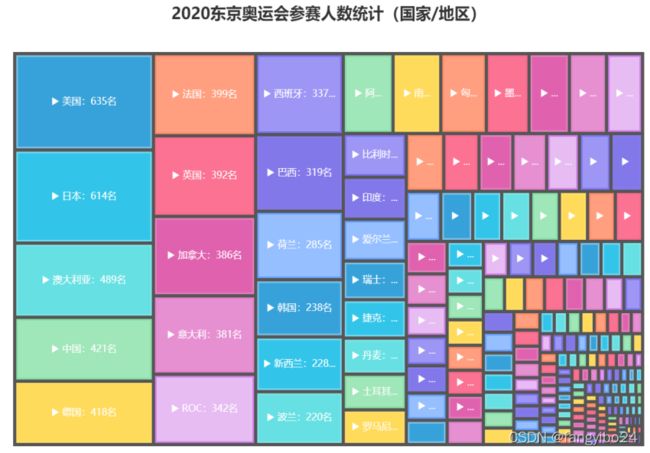
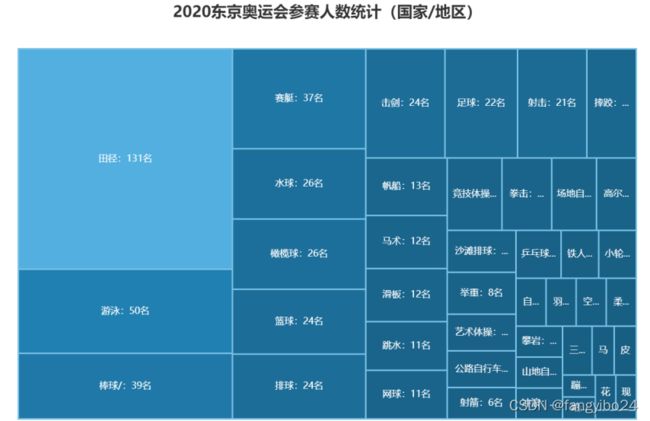
例如,点击【美国】,可以得到美国各个比赛项目的参赛人数统计。
2. 按赛事类型聚合矩形树图
# [可视化]按运动项目统计运动员数量
from pyecharts.charts import TreeMap
from pyecharts import options as opts

athletes_df=pd.read_csv("./DataSet/Athletes/athletes.csv")
df_t = athletes_df.groupby(['sports', 'Team_NOC'])['name'].count().reset_index()
df_t.columns = ['赛事', '国家奥委会', '人数']

data = []
event = []
for idx, row in df_t.iterrows():
    if row['赛事'] in event:
        data[-1]['children'].append(dict(name=row['国家奥委会'], value=row['人数']))
    else:
        data.append(dict(name=row['赛事'], children=[dict(name=row['国家奥委会'], value=row['人数'])]))
    event.append(row['赛事'])


tree = TreeMap(
    init_opts=opts.InitOpts(
        theme='light',
        width='1000px',
        height='600px',
        # bg_color='rgb(0,0,0)'
        ))
tree.add(
    "参赛人数",
    data,
    leaf_depth=1,
    label_opts=opts.LabelOpts(position="inside", formatter='{b}:{c}名'),
    levels=[
            opts.TreeMapLevelsOpts(
                treemap_itemstyle_opts=opts.TreeMapItemStyleOpts(
                    border_color="#555", border_width=4, gap_width=4
                )
            ),
            opts.TreeMapLevelsOpts(
                color_saturation=[0.3, 0.6],
                treemap_itemstyle_opts=opts.TreeMapItemStyleOpts(
                    border_color_saturation=0.7, gap_width=2, border_width=2
                ),
            ),
            opts.TreeMapLevelsOpts(
                color_saturation=[0.3, 0.5],
                treemap_itemstyle_opts=opts.TreeMapItemStyleOpts(
                    border_color_saturation=0.6, gap_width=1
                ),
            ),
            # opts.TreeMapLevelsOpts(color_saturation=[0.3, 0.5]),
        ],
    )
tree.set_global_opts(
    title_opts=opts.TitleOpts(
        title="2020东京奥运会参赛人数统计(赛事)",
        pos_left='center',
        title_textstyle_opts=opts.TextStyleOpts(font_size=20)
        ),
    legend_opts=opts.LegendOpts(
        is_show=False
        )
    )
tree.render('./Visual/运动员数量[赛事].html')
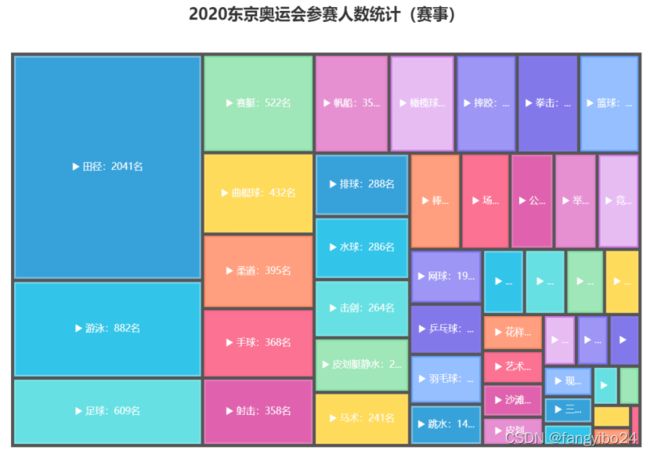
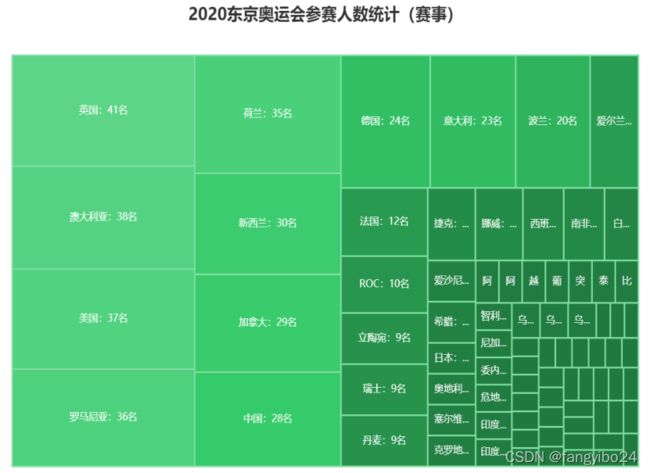
例如,点击【赛艇】,可以得到各个国家奥委会在该项目的参赛人数统计。
3.2.2 地理可视化
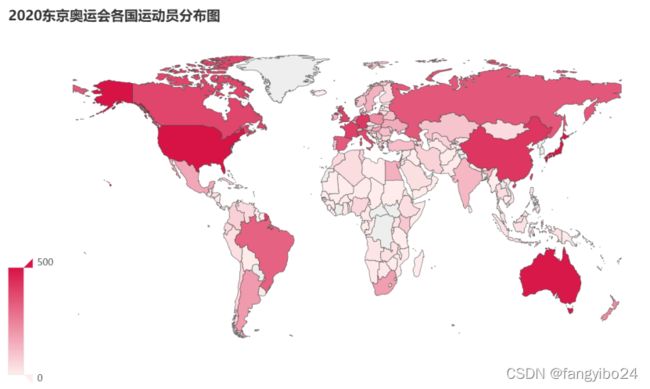
1. 各国运动员分布地图
#[可视化]东京奥运会各国运动员分布地图
from pyecharts import options as opts
from pyecharts.charts import Map

# 名称映射
namemap_df=pd.read_csv("./DataSet/国家名中英文对照表.csv")
name_map=dict(namemap_df[['名称','英文名称']].values.tolist())
# 运动员数量统计
athlete_df=pd.read_csv("./DataSet/Athletes/athletes.csv")
data_list=athlete_df.groupby(by=['Team_NOC'])['name'].count().reset_index().values.tolist()
data_list2=[]
for data in data_list:
    if data[0] in name_map.keys():
        data=[name_map[data[0]],data[1]]
        data_list2.append(data)
map = (
    Map()
    .add("", data_list2, "world",
         is_map_symbol_show=False,
         )
    .set_series_opts(label_opts=opts.LabelOpts(is_show=False))
    .set_global_opts(
        title_opts=opts.TitleOpts(title="2020东京奥运会各国运动员分布图"),
        visualmap_opts=opts.VisualMapOpts(max_=500,range_color=['#feeeed','#d71345'])
    )
    .render("./Visual/[地图]各国运动员分布图.html")
)
3.2.3 比例可视化
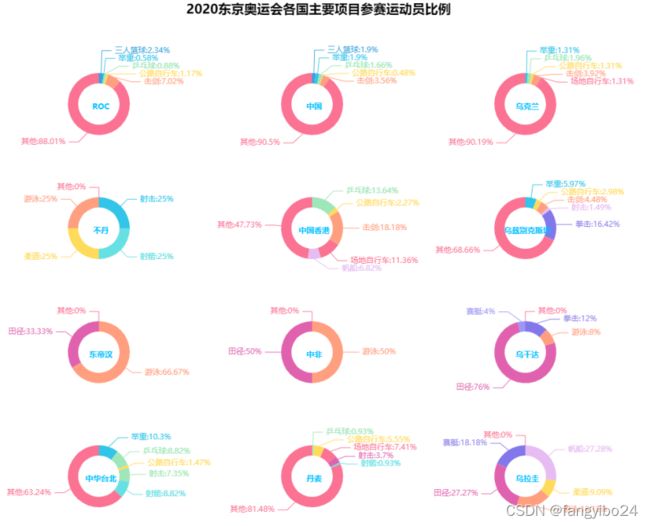
1. 各国主要项目参赛运动员比例
此处的组合饼图学习自另一个作者的可视化文章,但笔者暂时找不到当时那篇博文,等我找到后再补上原文链接!!!
利用Pandas从CSV中获取运动员数据,并按各国参赛项目计数:
pie = Pie(
    init_opts=opts.InitOpts(
        theme='light',
        width='1000px',
        height='800px',
    )
)
titles = [dict(
            text='2020东京奥运会各国主要项目参赛运动员比例',
            left='center',
            top='0%',
            textStyle=dict(
                color='#000',
                fontSize=20)
                )
                ]
for i, c in enumerate(country_list):
    d = df_t[df_t['Team_NOC'] == c].reset_index()
    data_pair = []
    else_num = 0
    for idx, row in d.iterrows():
        if idx < 5:
            data_pair.append(
                opts.PieItem(
                    name=row['sports'],
                    value=row['number'],
                    label_opts=opts.LabelOpts(
                        is_show=True, formatter='{b}:{d}%')
                )
            )
        else:
            else_num += row['number']
    data_pair.append(
        opts.PieItem(
            name='其他',
            value=else_num,
            label_opts=opts.LabelOpts(
                is_show=True, formatter='{b}:{d}%')
        )
    )

    pos_x = '{}%'.format(int(i / 4) * 33 + 16)
    pos_y = '{}%'.format(i % 4 * 24 + 20)

    titles.append(
        dict(
            text=c+' ',
            left=pos_x,
            top=pos_y,
            textAlign='center',
            textVerticalAlign='middle',
            textStyle=dict(
                color='#00BFFF',
                fontSize=12)
                )
    )

    pie.add(
        c,
        data_pair,
        center=[pos_x, pos_y],
        radius=['8%', '12%']
    )
 pie.set_global_opts(
    legend_opts=opts.LegendOpts(is_show=False),
    title_opts=titles
)
pie.render("./Visual/[组合饼图]各国主要项目参赛运动员比例.html")
3.3 国家奥委会可视化
3.3.1 比例可视化
1. 东京奥运会参赛国家获奖比例水滴图
利用Pandas从CSV中获取参赛国家和获奖国家列表和数量:
#[可视化]东京奥运会参赛国家获奖比例水滴图
import pandas as pd
from pyecharts.charts import Liquid
from pyecharts import options as opts
from pyecharts.globals import SymbolType

c = (
    Liquid()
    .add("", [round(len(medals_country)/len(engage_country),2), 1-round(len(medals_country),2)], is_outline_show=False, shape=SymbolType.DIAMOND)
    .set_global_opts(title_opts=opts.TitleOpts(title="2020东京奥运会参赛国家获奖比例",title_textstyle_opts=opts.TextStyleOpts(font_size=20)))
    .render("./Visual/[水滴图]东京奥运会参赛国家获奖比例.html")
)

可以更改水滴图的形状样式:
#[可视化]东京奥运会参赛国家获奖比例水滴图
import pandas as pd
from pyecharts.charts import Liquid
from pyecharts import options as opts
from pyecharts.globals import SymbolType

c = (
    Liquid()
    .add("", [round(len(medals_country)/len(engage_country),2)])
    .set_global_opts(title_opts=opts.TitleOpts(title="2020东京奥运会参赛国家获奖比例",title_textstyle_opts=opts.TextStyleOpts(font_size=20)))
    .render("./Visual/[水滴图]东京奥运会参赛国家获奖比例.html")
)

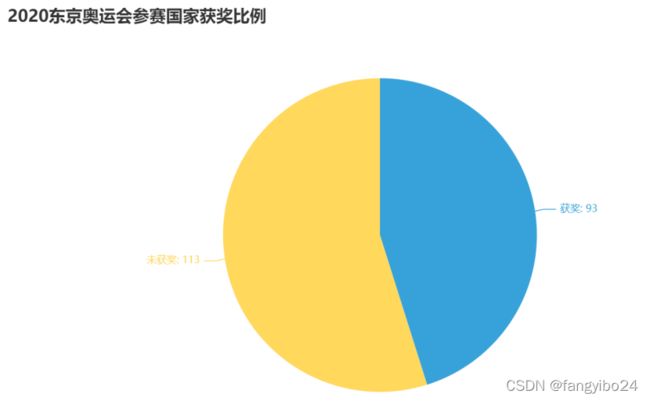
2. 东京奥运会参赛国家获奖比例饼图
利用Pandas从CSV中获取参赛国家和获奖国家列表和数量:

#[可视化]东京奥运会参赛国家获奖比例饼图
from pyecharts import options as opts
from pyecharts.charts import Pie
from pyecharts.globals import ThemeType

c = (
    Pie(init_opts=opts.InitOpts(theme=ThemeType.LIGHT))
    .add("",[['获奖',93],["未获奖",113]])
    .set_series_opts(label_opts=opts.LabelOpts(formatter="{b}: {c}"))
    .set_global_opts(
        title_opts=opts.TitleOpts(title='2020东京奥运会参赛国家获奖比例',title_textstyle_opts=opts.TextStyleOpts(font_size=20)),
        legend_opts=opts.LegendOpts(is_show=False)
    )
    .render("./Visual/[饼图]东京奥运会参赛国家获奖比例饼图.html")
)
3. 东京奥运会参赛国家获奖比例组合图
#[可视化]东京奥运会参赛国家获奖比例组合图
import pandas as pd
from pyecharts.charts import Liquid, Pie, Grid
from pyecharts import options as opts
from pyecharts.globals import SymbolType
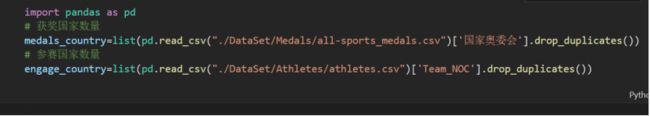
# 获奖国家数量
medals_country=list(pd.read_csv("./DataSet/Medals/all-sports_medals.csv")['国家奥委会'].drop_duplicates())
# 参赛国家数量
engage_country=list(pd.read_csv("./DataSet/Athletes/athletes.csv")['Team_NOC'].drop_duplicates())
liquid = (
Liquid()
.add("", [round(len(medals_country)/len(engage_country),2)],center=['70%','50%'])
.set_global_opts(title_opts=opts.TitleOpts(title="2020东京奥运会参赛国家获奖比例",title_textstyle_opts=opts.TextStyleOpts(font_size=20)))
)
pie = (
Pie(init_opts=opts.InitOpts(theme=ThemeType.LIGHT))
.add("",[['获奖',93],["未获奖",113]],center=['30%','50%'],radius=['20%','50%'])
.set_series_opts(label_opts=opts.LabelOpts(formatter="{b}: {c}"))
.set_global_opts(
title_opts=opts.TitleOpts(title='2020东京奥运会参赛国家获奖比例',title_textstyle_opts=opts.TextStyleOpts(font_size=20)),
legend_opts=opts.LegendOpts(is_show=True,pos_right='2%',pos_top='1%')
)
)
grid = (
Grid()
.add(pie, grid_opts=opts.GridOpts())
.add(liquid, grid_opts=opts.GridOpts())
.render("./Visual/[饼图水滴图]东京奥运会参赛国家获奖比例.html")
)

本项目以数据可视化的方式,结合可视分析学,对东京奥运会的数据进行搜集、处理、分析、提炼,并利用pyecharts绘制成可视化图表。至此,关于东京奥运会的可视化就结束啦,欢迎交流!