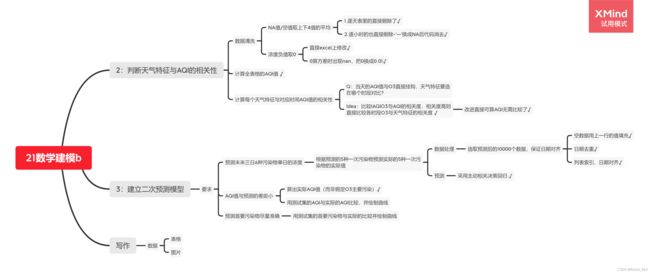
21华为杯数学建模B题--空气质量二次预测
文章目录
- 0.前言
- 1.问题重述
-
-
- 问题一
- 问题二
- 问题三
-
- 2.问题求解
-
-
- 问题一
- 问题二
- 问题三
-
0.前言
- 这是笔者第一次加入数学建模比赛,这篇文章作为自己这次竞赛的整个复盘,四天中,我们将题目做到了第三问,由于时间问题,第三问没能做出,不过我们已然满足。
- 所有的文件(包括试题,我的代码,生成的表格数据)全都放在一下链接中:21_研究生数学建模.zip。
1.问题重述
问题一
根据物种污染物的浓度及给定公式计算5日的AQI值以及首要污染物。
问题二
计算气象条件与污染物浓度的相似度。并且分类气象条件。
问题三
对历史的一次预测数据再进行二次预测。
2.问题求解
问题一
先进行数据清理,清理部分是函数Clean_data().再计算每一日的AQI,用到的函数是AQI()
def Clean_data(file,sheet,new,cut=[0]):
    #设置在终端显示的最大行列
    pd.set_option('display.max_columns',300)
    pd.set_option('display.max_rows',300)
    empty_values = ['—','NA']
    #打开表,给的字符换成空值
    df2 = pd.read_excel(file,sheet_name=sheet, na_values=empty_values)
    #用前一行的0补充空值
    new_df2 = df2.fillna(method='pad',axis=0)
    #去除日期的重行
    try:
        new_df2 = new_df2.drop_duplicates(['预测时间'],keep='first')
    except:
        try:
            new_df2 = new_df2.drop_duplicates(['监测日期'],keep='first')
        except:pass
    if cut != [0]:
        new_df2 = new_df2.iloc[:,cut]

    # #清洗掉空行
    # new_df2 = df2.dropna(how='any')
    #表二的切片数据
    # df2p = df2.iloc[1:820,2:7]
    # 写入表单
    new_df2.to_excel(new, sheet_name=sheet,index=False)
 #int->Cp为浓度;string->mold是污染物类型
def calcIAQI(Cp,mold):
    #index是污染物的限值
    index_i=[0,50,100,150,200,300,400,500]
    if mold=='pm2.5':
        index=[0,35,75,115,150,250,350,500]
    elif mold=='pm10':
        index=[0,50,150,250,350,420,500,600]
    elif mold=='CO':
        index=[0,2,4,14,24,36,48,60]
    elif mold=='SO2':
        index=[0,50,150,475,800,1600,2100,2620]
    elif mold=='NO2':
        index=[0,40,80,180,280,565,750,940]
    elif mold=='O3':
        index=[0,100,160,215,265,800]
    else:
        return 'Unknown'

    # 选定当前浓度所在的区间
    for i in index:
        if i>Cp:
            break;
    j=index.index(i)
    Ih=float(index_i[j])
    Il=float(index_i[j-1])
    BPh=float(index[j])
    BPl=float(index[j-1])
    C=float(Cp)
    iaqi=(Ih-Il)*(C-BPl)/(BPh-BPl)+Il
    return int(iaqi+0.5)

# 输入当天的污染物浓度返回AQI值
def AQI(pollution):
    [so2,no2,pm10,pm2dot5,o3,co] = pollution
    IAQI={'pm2.5':calcIAQI(pm2dot5,'pm2.5')}
    if pm10!=0:
        IAQI['pm10']=(calcIAQI(pm10,'pm10'))
    if co!=0:
        IAQI['CO']=(calcIAQI(co,'CO'))
    if so2!=0:
        IAQI['SO2']=(calcIAQI(so2,'SO2'))
    if no2!=0:
        IAQI['NO2']=(calcIAQI(no2,'NO2'))
    if o3!=0:
        IAQI['O3']=(calcIAQI(o3,'O3'))

    #Print all of the result .Only return the AQI as the result
    # print (IAQI)
    max_key_value = max(IAQI.items(), key = lambda x: x[1])
    return max_key_value
问题二
求逐小时的每个气象特征与每个的污染物浓度的R平方数(R平方数与皮尔逊系数相当接近),用到的函数是computeCorrelation()
#用于计算R方,x、y均为矩阵
def computeCorrelation(x, y):
    xbar = np.nanmean(x)
    ybar = np.nanmean(y)
    SR = 0
    varX = 0
    varY = 0
    for i in range(0, len(x)): #多少实例
        diffxx = x[i] - xbar
        diffyy = y[i] - ybar
        SR += (diffxx * diffyy)
        varX += diffxx ** 2 # 求平方然后累计起来
        varY += diffyy ** 2 # 求平方然后累计起来
    ST = math.sqrt(varX * varY)
    #返回R方=方差/总方差
    return SR / ST

#以行 为污染物与API,列为天气特征生成R方的表格
def solve_ques2(pollution,Air_condition,AQI):
    #取出附件一中表二每一个空气特征的数组
    Air_condition_arry = Air_condition
    Air_condition_items = ['温度','湿度','气压','风速','风向']
    pollution_arry = pollution
    pollution_items = ['so2','no2','pm10','pm2dot5','co','o3']
    R_squre_ans = []
    # PCC_ans = []
    df_R = pd.DataFrame({'Condition':Air_condition_items})
    #求每个天气特征与污染物的R方,i为列,j为行,并追加到表中
    for i in range(len(pollution_items)):
        for j in range(len(Air_condition_items)):
            R_squre_ans.append(computeCorrelation(Air_condition_arry[j],pollution_arry[i]))
        df_R.insert(i+1,pollution_items[i],R_squre_ans)
        R_squre_ans = []
    #求天气特征与AQI的R方,并追加到表中
    for j in range(len(Air_condition_items)):
        R_squre_ans.append(computeCorrelation(Air_condition_arry[j],AQI))
    df_R.insert(len(pollution_items)+1,'AQI',R_squre_ans)
    df_R.to_excel('R_Square.xlsx', sheet_name='sheet1',index=False)
问题三
二次预测时用到了机器学习,选取一个模型后以x为一次预测的污染物浓度,y为实际污染物浓度。以前83%为训练集,后17%为测试集进行训练,最后返回出未来三天的预测值。
#预测5个污染物再下三天的值,x,y均为pandas的df形式(该函数实际测了6个污染物,没时间改了)
def train_5_pollution(model):
    #先修改个路径
    print(os.getcwd())#显示当前路径
    os.chdir('D:\Code\MathCompetition\question3')
    #导入文件
    df_a_pred = pd.read_excel('A_short_pred.xlsx',sheet_name='sheet1')
    df_b_pred = pd.read_excel('B_short_pred.xlsx',sheet_name='sheet1')
    df_c_pred = pd.read_excel('C_short_pred.xlsx',sheet_name='sheet1')
    df_a_real = pd.read_excel('A_short_real.xlsx',sheet_name='sheet1')
    df_b_real = pd.read_excel('B_short_real.xlsx',sheet_name='sheet1')
    df_c_real = pd.read_excel('C_short_real.xlsx',sheet_name='sheet1')
    df_future = pd.read_excel('predict1_future.xlsx',sheet_name='Sheet1')
    #向下追加表单
    df_pred = df_a_pred.append(df_b_pred,ignore_index=True)
    df_pred = df_pred.append(df_c_pred,ignore_index=True)
    df_real = df_a_real.append(df_b_real,ignore_index=True)
    df_real = df_real.append(df_c_real,ignore_index=True)
    df_pred.to_excel('first_pred.xlsx',sheet_name='sheet1',index=False)
    df_real.to_excel('all_history.xlsx',sheet_name='sheet1',index=False)
    score=[]

    #分割数据
    x_fix_test = df_pred.iloc[10000:12000,:]
    x_fix_train = df_pred.iloc[0:10000,:]
    y_fix_test = df_real.iloc[10000:12000,:]
    y_fix_train = df_real.iloc[0:10000,:]
    pollution_items = ['so2','no2','pm10','pm2dot5','co','o3']
    x_fix_test.to_excel('x_fix_test.xlsx',sheet_name='sheet1',index=False)
    y_fix_test.to_excel('y_fix_test.xlsx',sheet_name='sheet1',index=False)
    #开跑
    j = 0
    for i in [2,3,4,5,6,7] :
        x_test = x_fix_test.iloc[:,[i]]
        y_test = y_fix_test.iloc[:,[i]]
        x_train = x_fix_train.iloc[:,[i]]
        y_train = y_fix_train.iloc[:,[i]]
        # x_train, x_test, y_train, y_test = train_test_split(x, y, test_size=0.25)
        model.fit(x_train,y_train)
        score.append(model.score(x_test, y_test))
        result = model.predict(x_test)
        future_pred = df_future.iloc[:,[i]]
        future = model.predict(future_pred)
        future_topd = pd.Series(future)
        result_topd = pd.Series(result)
        future_topd.to_excel('future'+pollution_items[j]+'.xlsx',sheet_name='sheet1',index=False)
        result_topd.to_excel('test_'+pollution_items[j]+'_result.xlsx')
        j += 1
    print(score)
    score_topd = pd.Series(score)
    score_topd.to_excel('score_test.xlsx')
