Python计算温度植被干旱指数(TVDI)
温度植被干旱指数TVDI(Temperature Vegetation Dryness Index)是一种基于光学与热红外遥感通道数据进行植被覆盖区域表层土壤水分反演的方法。
项目地址 https://github.com/zhengjie9510/tvdi
1、原理
LST-NDVI特征空间1:
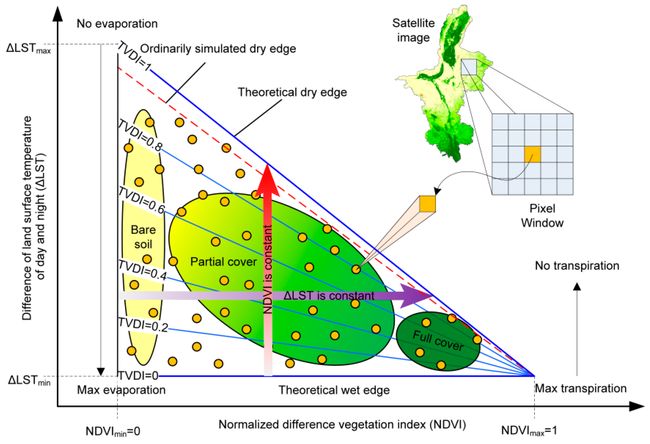
温度植被干旱指数(TVDI)的计算方法为:
T V D I = L S T − L S T m i n L S T m a x − L S T m i n TVDI = {LST - LST_{min} \over LST_{max} - LST_{min}} TVDI=LSTmax−LSTminLST−LSTmin
L S T m i n = a + b × N D V I LST_{min} = {a + b \times NDVI} LSTmin=a+b×NDVI
L S T m a x = c + d × N D V I LST_{max} = {c + d \times NDVI} LSTmax=c+d×NDVI
其中 a 、 b 、 c 、 d a、b、c、d a、b、c、d为干、湿边拟合系数
2、部分Python代码
import gdal
from gdalconst import *
import numpy as np
from glob import glob
from os import path as osp
import os, subprocess
import matplotlib.pyplot as plt
# 获取lst、ndvi数据
def get_data(file_ndvi,file_lst):
ndvi_tif=gdal.Open(file_ndvi,GA_ReadOnly)
lst_tif=gdal.Open(file_lst,GA_ReadOnly)
ndvi_band=ndvi_tif.GetRasterBand(1)
ndvi=ndvi_band.ReadAsArray()
lst_band=lst_tif.GetRasterBand(1)
lst=lst_band.ReadAsArray()
return ndvi,lst
# 获取投影等信息,用于保存TVDI结果
def get_info(file_ndvi):
ndvi_tif=gdal.Open(file_ndvi,GA_ReadOnly)
ndvi_band=ndvi_tif.GetRasterBand(1)
gt = ndvi_tif.GetGeoTransform()
proj = ndvi_tif.GetProjectionRef()
dtype = ndvi_band.DataType
return gt,proj,dtype
# 计算lst的最小值(湿边)和最大值(干边)
def get_min_max(ndvi,lst):
MiniList = []
MaxList = []
# 创建ndvi向量(0到1,间距为0.01)
ndvi_vector = np.round(np.arange(0.01, 1.01, 0.01), 2)
# 首先找到相同ndvi的lst值
for val in ndvi_vector:
lst_lst_val = []
row, col = np.where((ndvi >= val-0.001) & (ndvi <= val+0.001))
# 根据这些ndvi的位置,我们取温度值对应这些位置(行和列)
for i in range(len(row)):
if np.isfinite(lst[row[i], col[i]]):
lst_lst_val += [lst[row[i], col[i]]]
# 如果所需的ndvi有lst值,则计算最大值和最小值
if lst_lst_val != []:
lst_min_val = np.min(lst_lst_val)
lst_max_val = np.max(lst_lst_val)
else:
lst_min_val = np.nan
lst_max_val = np.nan
# 找到的值被添加到MiniList和MaxList列表中
MiniList += [lst_min_val]
MaxList += [lst_max_val]
return MiniList,MaxList
def fit(MiniList,MaxList):
ndvi_vector = np.round(np.arange(0.01, 1.01, 0.01), 2)
MiniList_fin = []
ndvi_fin = []
for i, val in enumerate(MiniList):
if np.isfinite(val):
MiniList_fin += [val]
ndvi_fin += [ndvi_vector[i]]
MinPfit = np.polyfit(ndvi_fin[14:89], MiniList_fin[14:89], 1)
MaxList_fin = []
ndvi_fin = []
for i, val in enumerate(MaxList):
if np.isfinite(val):
MaxList_fin += [val]
ndvi_fin += [ndvi_vector[i]]
MaxPfit = np.polyfit(ndvi_fin[14:89], MaxList_fin[14:89], 1)
return MinPfit,MaxPfit
def plot_scatter(ndvi,lst,MiniList,MaxList,MinPfit,MaxPfit,scatter_file=None):
ndvi_vector = np.round(np.arange(0.01, 1.01, 0.01), 2)
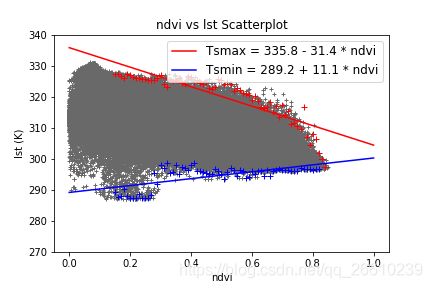
a1, b1 = MaxPfit
a2, b2 = MinPfit
linhamax = [b1 + (a1 * 0), b1 + (a1 * 1)]
linhamin = [b2 + (a2 * 0), b2 + (a2 * 1)]
plt.plot(ndvi.ravel(), lst.ravel(), "+", color='dimgray', markersize=4)
plt.plot(ndvi_vector[14:89], MiniList[14:89], '+', color='b')
plt.plot(ndvi_vector[14:89], MaxList[14:89], '+', color='r')
if a1>0:
plt.plot([0, 1], linhamax, color='r', markersize=8,\
label=f"Tsmax = {'%.1f'% b1} + {'%.1f' % abs(a1)} * ndvi")
else:
plt.plot([0, 1], linhamax, color='r', markersize=8,\
label=f"Tsmax = {'%.1f'% b1} - {'%.1f' % abs(a1)} * ndvi")
if a2>0:
plt.plot([0, 1], linhamin, color='b', markersize=8,\
label=f"Tsmin = {'%.1f' % b2} + {'%.1f' % abs(a2)} * ndvi")
else:
plt.plot([0, 1], linhamin, color='b', markersize=8,\
label=f"Tsmin = {'%.1f' % b2} - {'%.1f' % abs(a2)} * ndvi")
plt.legend(loc='upper right', fontsize=12)
plt.ylim(top=340,bottom=270)
plt.xlabel("ndvi")
plt.ylabel("lst (K)")
plt.title("ndvi vs lst Scatterplot")
if scatter_file is not None:
plt.savefig(scatter_file)
plt.show()
def show_tvdi(tvdi,fig_file=None):
plt.imshow(tvdi,cmap= 'jet_r',vmax=1,vmin = 0)
plt.axis('off')
plt.colorbar()
plt.title("tvdi")
if fig_file is not None:
plt.savefig(fig_file)
plt.show()
def compute_tvdi(ndvi,lst,MinPfit,MaxPfit):
a1, b1 = MaxPfit
a2, b2 = MinPfit
Ts_max = b1 + (a1 * ndvi)
Ts_min = b2 + (a2 * ndvi)
TVDI = (lst - Ts_min) / (Ts_max - Ts_min)
return TVDI
def save_tvdi(TVDI,gt,proj,dtype,file_out):
fname_out = file_out
driver = gdal.GetDriverByName('GTiff')
data_type = dtype
dset_output = driver.Create(fname_out, TVDI.shape[1], TVDI.shape[0], 1, gdal.GDT_Float32)
dset_output.SetGeoTransform(gt)
dset_output.SetProjection(proj)
dset_output.GetRasterBand(1).WriteArray(TVDI)
dset_output.FlushCache()
dset_output = None
def main(ndvi_file,lst_file,tvdi_file,scatter_file=None,fig_file=None):
'''
Parameters
----------
ndvi_file : the file of ndvi
lst_file : the file of lst
tvdi_file : the file use to save tvdi
scatter_file : the file use to save scatter
fig_file : the file use to save the figure of tvdi
'''
# 获取ndvi和lst数据
ndvi,lst=get_data(ndvi_file,lst_file)
ndvi[ndvi<0]=np.nan
lst[lst<250]=np.nan
# 获取lst的最小值(湿边)和最大值(干边)
MiniList,MaxList=get_min_max(ndvi,lst)
# 计算tvdi,并保存
MinPfit,MaxPfit=fit(MiniList,MaxList)
tvdi=compute_tvdi(ndvi,lst,MinPfit,MaxPfit)
gt,proj,dtype=get_info(ndvi_file)
save_tvdi(tvdi,gt,proj,dtype,tvdi_file)
# 显示散点图
plot_scatter(ndvi,lst,MiniList,MaxList,MinPfit,MaxPfit,scatter_file)
# 展示tvdi结果
show_tvdi(tvdi,fig_file)
if __name__ == '__main__':
ndvi_file=r'*.tif'
lst_file=r'*.tif'
tvdi_file=r'*.tif'
main(ndvi_file,lst_file,tvdi_file)
3、结果展示
LST-NDVI的散点图:
TVDI展示:

如果对您有用的话,别忘了给点个赞哦_ !
4、参考文献
- [1] Du L, Song N, Liu K, et al. Comparison of Two Simulation Methods of the Temperature Vegetation Dryness Index (TVDI) for Drought Monitoring in Semi-Arid Regions of China[J]. Remote Sensing, 2017, 9(2): 177.