MATLAB数字图像处理常见实验代码
实验代码结果展示
此代码使用的编译器为MATLAB2018b及以上的版本
- 求1到10的阶乘之和
sum = 0;
for i = 1:10
    sum = sum + factorial(i);
end
disp(sum);
- 输出100-999之内的所有“水仙花数”。“水仙花数”是指一个3位数,其各位数字立方和等于该数本身
for m=100:999
    m1=fix(m/100);
    m2=rem(fix(m/10),10);
    m3=rem(m,10);
    if m==m1*m1*m1+m2*m2*m2+m3*m3*m3
    disp(m)
    end
end
- 输入三个数,按从小到大的顺序输出
a = input('请输入第一个数值:');
b = input('请输入第二个数值:');
c = input('请输入第三个数值:');
m = 0;
if a > b
    m = a;
    a = b;
    b = m;
end
 if a > c
    m = a;
    a = c;
    c = m;
 end
 if b > c
    m = c;
    c = b;
	b = m;
 end
 a
 b
 c
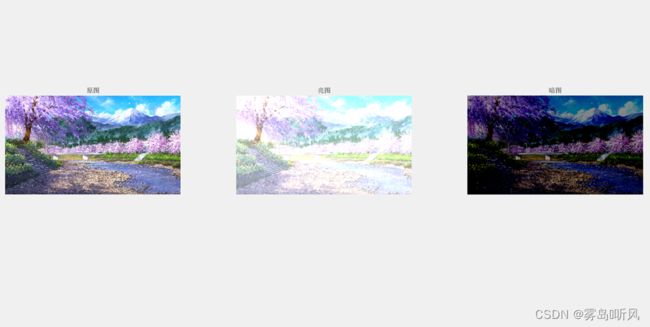
- 读入一幅图像,然后给这幅图像加上一个常数,或者从这幅图像中减去一个常数
pic1 = imread("图片路径");
pic2 = imadd(pic1,120);
pic3=imsubtract(pic1,120);
figure;subplot(1,3,1);imshow(pic1);title("原图");
subplot(1,3,2);imshow(pic2);title("亮图");
subplot(1,3,3);imshow(pic3);title("暗图");
- 输入一个年份,判断其是否为闰年
y=input("请输入需要查询的年份:");
if (rem(y,4)==0&&rem(y,100)~=0)||rem(y,400)==0
    fprintf("%d是闰年",y);
else
    fprintf("%d是平年 ",y);
end
- 利用linspace和logspace分别生成一个有10个元素的向量
a = linspace(1,19,10)
b = logspace(2,3,10)
- 利用magic生成一个 8阶的魔方矩阵A,并把A保存为data.mat
A = magic(8)
save data.mat
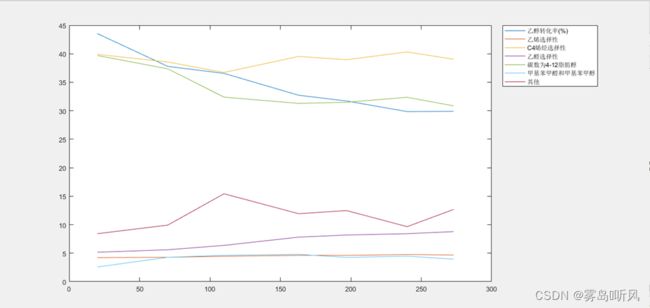
- 读取data.xslx文件里的数据,将其第一列作为横坐标x,第二列至最后一列依次作为纵坐标y1,y2,y3,……,然后使用plot函数分别绘制对应数据的曲线图,并在同一个figure上显示出来
num = xlsread('数据路径');
x=num(:,1);
y1=num(:,2);
y2=num(:,3);
y3=num(:,4);
y4=num(:,5);
y5=num(:,6);
y6=num(:,7);
y7=num(:,8);
figure;plot(x,y1,x,y2,x,y3,x,y4,x,y5,x,y6,x,y7);
legend('乙醇转化率(%)','乙烯选择性','C4烯烃选择性','乙醛选择性','碳数为4-12脂肪醇 ','甲基苯甲醛和甲基苯甲醇','其他','Location','NorthEastOutside')
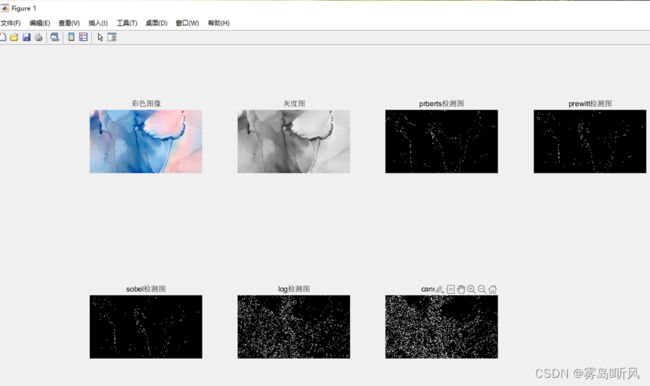
- 读入一幅彩色图像,将其转化为灰度图,然后使用roberts、prewitt、sobel、log、canny等算子分别对灰度图进行边缘检测,并把结果显示在同一个figure上
a=imread('2022.jpg');
b=rgb2gray(a);
c1=edge(b,'roberts');
c2=edge(b,'prewitt');
c3=edge(b,'sobel');
c4=edge(b,'log');
c5=edge(b,'canny');
figure;subplot(2,4,1);imshow(a);title('彩色图像');
subplot(2,4,2);imshow(b);title('灰度图');
subplot(2,4,3);imshow(c1);title('prberts检测图');
subplot(2,4,4);imshow(c2);title('prewitt检测图');
subplot(2,4,5);imshow(c3);title('sobel检测图');
subplot(2,4,6);imshow(c4);title('log检测图');
subplot(2,4,7);imshow(c5);title('canny检测图');
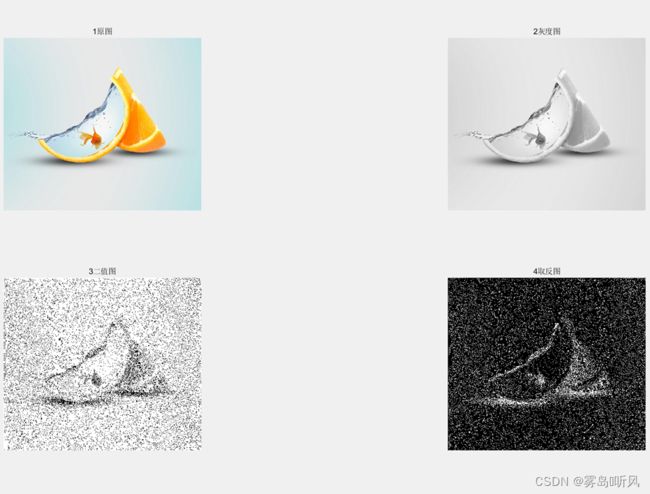
- 读入一幅真彩色图像,先将其转化为灰度图像,然后再将灰度图像抖动成二值图像,并对得到的二值图像进行取反,最后把真彩色图像、灰度图像、二值图像、取反后的二值图像显示在同一个figure上
imag = imread('1.png');
imag1 = rgb2gray(imag);
imag2 = dither(imag1);
imag3 = imcomplement(imag2);
figure;subplot(2,2,1);imshow(imag);title('1原图');
subplot(2,2,2);imshow(imag1);title('2灰度图');
subplot(2,2,3);imshow(imag2);title('3二值图');
subplot(2,2,4);imshow(imag3);title('4取反图');
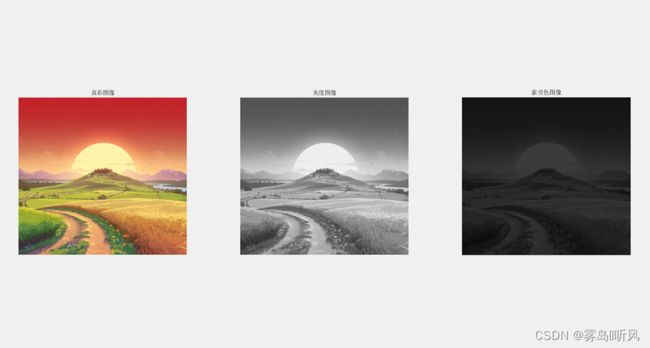
- 读入一幅真彩色图像,先将其转化为灰度图像,然后再将灰度图像转换为索引色图像,并把真彩色图像、灰度图像、索引色图像显示在同一个figure上
imag = imread('2.png');
imag1 = rgb2gray(imag);
imag2 = gray2ind(imag1);
figure;subplot(1,3,1);imshow(imag);title('真彩图像');
subplot(1,3,2);imshow(imag1);title('灰度图像');
subplot(1,3,3);imshow(imag2);title('索引色图像');
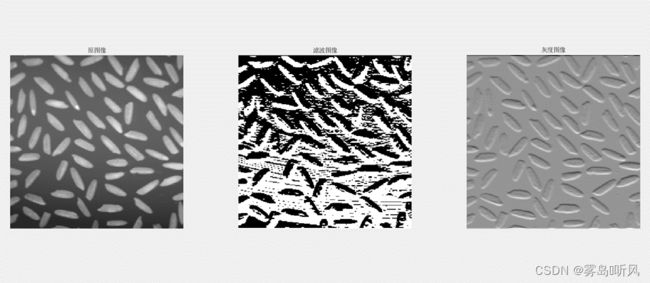
- 以图像rice.tif为例,先使用prewitt算子对其进行滤波,然后将滤波得到的数据矩阵转换为灰度图像,并把原图像、滤波后的图像、灰度图像显示在同一个figure上
imag = imread('rice.tif');
imag1 = filter2(fspecial('prewitt'),imag);
imag2 = mat2gray(imag1);
figure;subplot(1,3,1);imshow(imag);title('原图像');
subplot(1,3,2);imshow(imag1);title('滤波图像');
subplot(1,3,3);imshow(imag2);title('灰度图像');
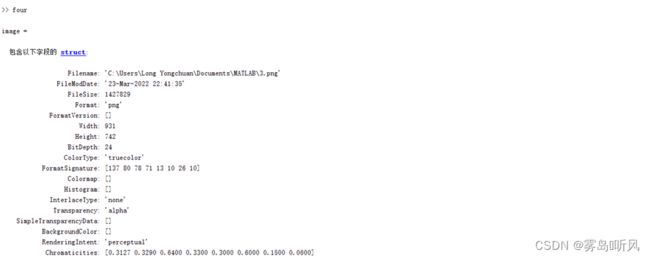
- 利用imfinfo函数对图像文件进行信息查询
image = imfinfo('3.png');
image
width = image.Width
heigh = image.Height
Format = image.Format
BitDepth = image.BitDepth
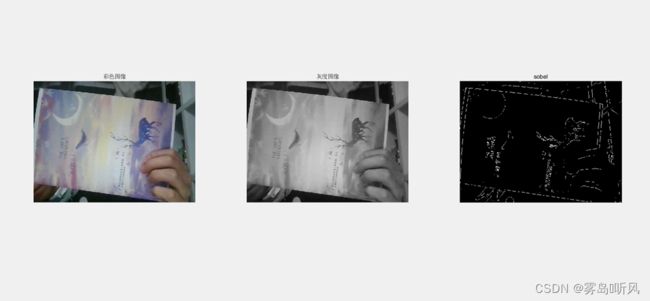
- 利用MATLAB打开笔记本摄像头获取某一帧图像,将其转化为灰度图像,并使用sobel算子对灰度图像进行边缘检测,最后把获取的图像、灰度图像、边缘检测图像显示在同一个figure上
video = videoinput('winvideo','1','YUY2_640x480');preview(video);
set(video,'ReturnedColorSpace','rgb');
rgb = getsnapshot(video);
frame = rgb2gray(rgb);
sobel = edge(frame,'sobel');
figure;subplot(131);imshow(rgb);title('彩色图像');
subplot(132);imshow(frame);title('灰度图像');
subplot(133);imshow(sobel);title('sobel');
- 将一幅真彩色图像沿水平方向和垂直方向各平移30
I = imread("1.png");
subplot(1,2,1),imshow(I);title('原始图像')
I1 = imtranslate(I,[30,30]);
subplot(1,2,2),imshow(I1);title('平移后的图像');
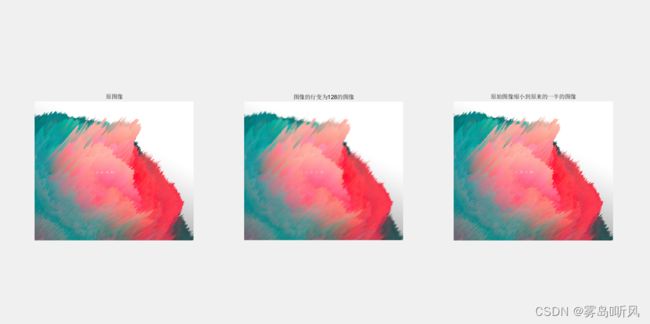
- 将一幅真彩色图像的行变为128,再使用最近邻插值将原始图像缩小到原来的一半
a = imread('2.png');
b = imresize(a,[128 NaN]);
c = imresize(a,0.5,'nearest');
subplot(1,3,1);imshow(a);title('原图像');
subplot(1,3,2);imshow(b);title('图像的行变为128的图像');
subplot(1,3,3);imshow(c);title('原始图像缩小到原来的一半的图像');
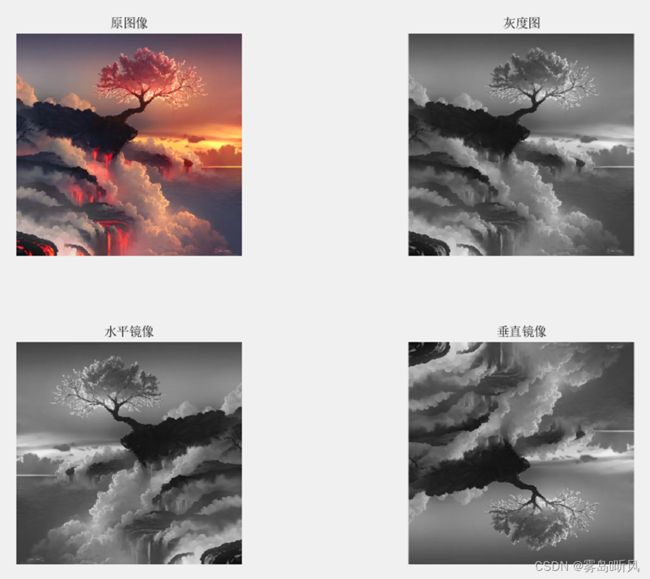
- 将一幅真彩色图像转化为灰度图像,再使用双线性插值实现灰度图像的水平镜像和垂直镜像
imag = imread('3.png');
imag1 = rgb2gray(imag);
[height,width,dim] = size(imag1);
tform = maketform('affine',[-1 0 0;0 1 0;width 0 1]);
imag2 = imtransform(imag1,tform,'nearest');
[height,width,dim] = size(imag1);
tform = maketform('affine',[1 0 0;0 -1 0;0 height 1]);
imag3 = imtransform(imag1,tform,'nearest');
subplot(2,2,1);imshow(imag);title('原图像');
subplot(2,2,2);imshow(imag1);title('灰度图');
subplot(2,2,3);imshow(imag2);title('水平镜像');
subplot(2,2,4);imshow(imag3);title('垂直镜像');
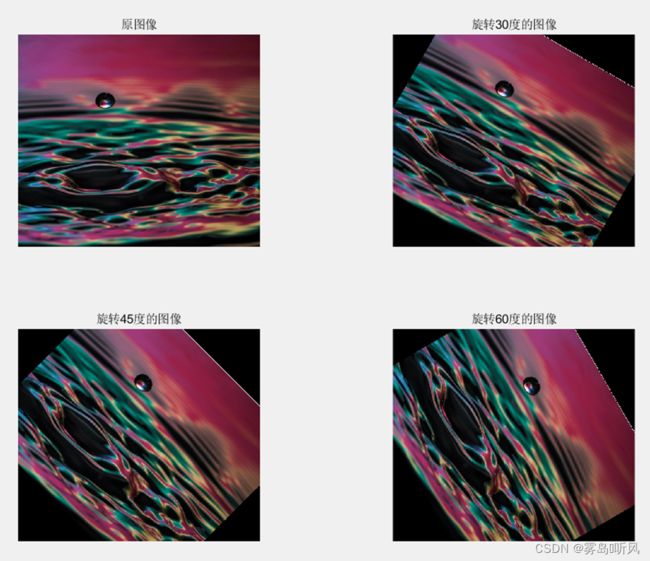
- 将一幅真彩色图像按顺时针依次旋转30°、45°、60°,并裁剪图像,使其和原图像大小一致
ima = imread('4.png');
subplot(221),imshow(ima);title('原图像');
ima1 = imrotate(ima,-30,'nearest','crop');
subplot(222),imshow(ima1);title('旋转30度的图像');
ima2 = imrotate(ima,-45,'nearest','crop');
subplot(223),imshow(ima2);title('旋转45度的图像');
ima3 = imrotate(ima,-60,'nearest','crop');
subplot(224),imshow(ima3);title('旋转60度的图像');
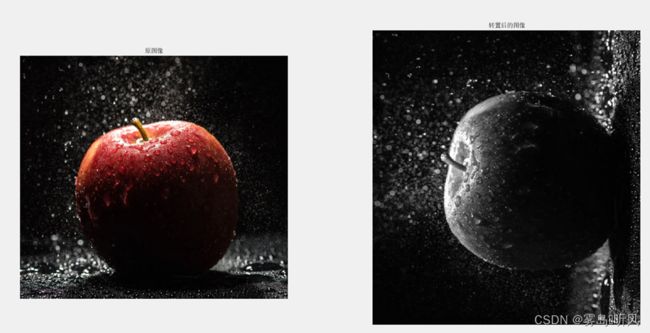
- 将一幅真彩色图像转置
t = imread("5.png");
subplot(1,2,1),imshow(t);title('原图像');
t1 = im2gray(t);
t11 = t1';
subplot(1,2,2),imshow(t11);title('转置后的图像');
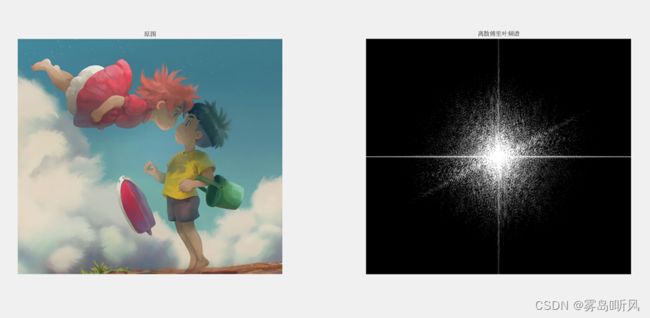
- 读入一幅图像,进行二维离散傅里叶变换,并将其坐标原点移到频谱图的中央位置
img = imread('1.png');
img1 = rgb2gray(img);
F = fft2(img1);
F1 = fftshift(F);
F2 = log(abs(F1));
subplot(121);imshow(img);title('原图');
subplot(122);imshow(F2,[8,10], 'InitialMagnification','fit');title('离散傅里叶频谱');
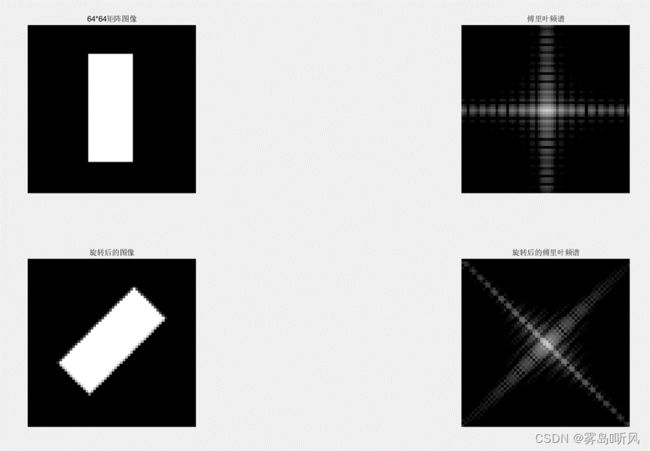
- 构造一幅64×64的图像,进行二维离散傅里叶变换,再将原始图像旋转45°,进行二维离散傅里叶变换
img = zeros(64,64);
img(12:52,24:40) = 1;
subplot(221);imshow(img,'InitialMagnification','fit');title('64*64矩阵图像');
img1 = fft2(img);
img2 = fftshift(img1);
img3 = log(abs(img2));
subplot(222);imshow(img3,[1,8]);title('傅里叶频谱');
img4 = imrotate(img,315,'bilinear','crop');
subplot(223);imshow(img4);title('旋转后的图像');
img5 = fft2(img4);
img6 = fftshift(img5);
img7 = log(abs(img6));
subplot(224);imshow(img7,[1,8]);title('旋转后的傅里叶频谱');
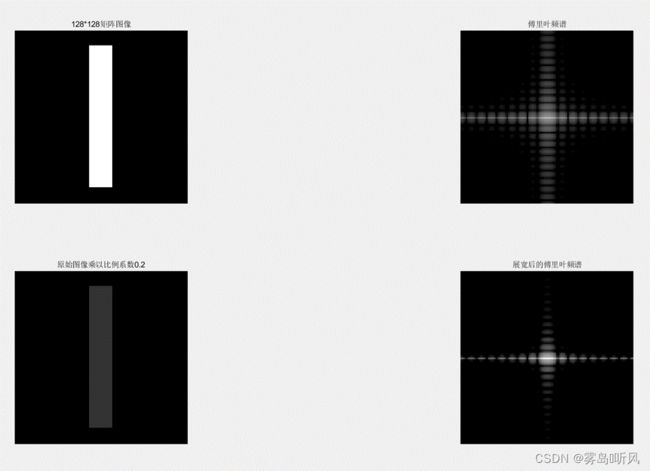
- 构造一幅128×128的图像,进行二维离散傅里叶变换,再将原始图像乘以比例系数0.2,进行二维离散傅里叶变换
img = zeros(128,128);
img(12:116,56:72) = 1;
subplot(221);imshow(img,'InitialMagnification','fit');title('128*128矩阵图像');
img1 = fft2(img);
img2 = fftshift(img1);
img3 = log(abs(img2));
subplot(222);imshow(img3,[1,10]);title('傅里叶频谱');
img4 = img*0.2;
subplot(223);imshow(img4);title('原始图像乘以比例系数0.2');
img5 = fft2(img4);
img6 = fftshift(img5);
img7 = log(abs(img6));
subplot(224);imshow(img7,[1,6]);title('展宽后的傅里叶频谱');
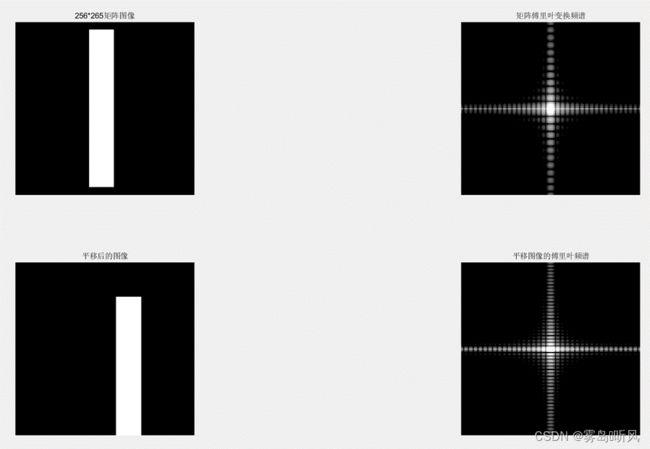
- 构造一幅256×256的图像,进行二维离散傅里叶变换,再将原始图像沿水平方向和垂直方向同时平移40,进行二维离散傅里叶变换
img = zeros(256,265);
img(12:244,110:146) = 1;
subplot(221);imshow(img,'InitialMagnification','fit');title('256*265矩阵图像');
img1 = fft2(img);
img2 = fftshift(img1);
img3 = log(abs(img2));
subplot(222);imshow(img3,[2,6]);title('矩阵傅里叶变换频谱');
img4 = imtranslate(img,[40,40]);
subplot(223);imshow(img4);title('平移后的图像');
img5 = fft2(img4);
img6 = fftshift(img5);
img7 = log(abs(img6));
subplot(224);imshow(img7,[2,6]);title('平移图像的傅里叶频谱');
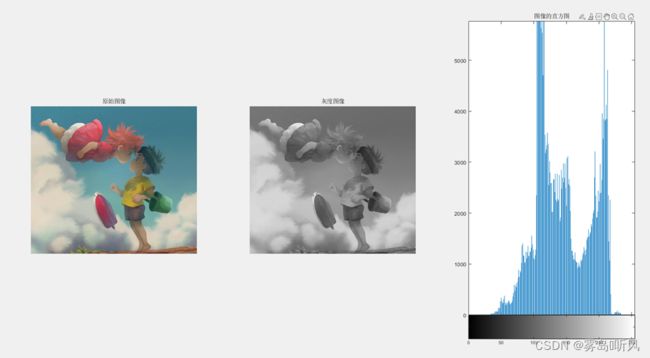
- 读入一幅图像,使用imhist( )函数显示图像的直方图
I = imread("1.png");
I1 = rgb2gray(I);
subplot(131),imshow(I);title('原始图像');
subplot(132),imshow(I1);title('灰度图像');
subplot(133),imhist(I1);title('图像的直方图');
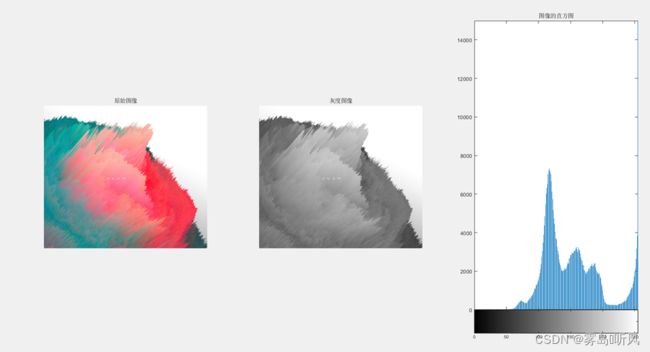
- 读入一幅图像,使用imcontour( )函数显示图像的等灰度值图
I = imread("2.png");
I1 = rgb2gray(I);
subplot(131),imshow(I);title('原始图像');
subplot(132),imshow(I1);title('灰度图像');
subplot(133),imhist(I1);title('图像的直方图');
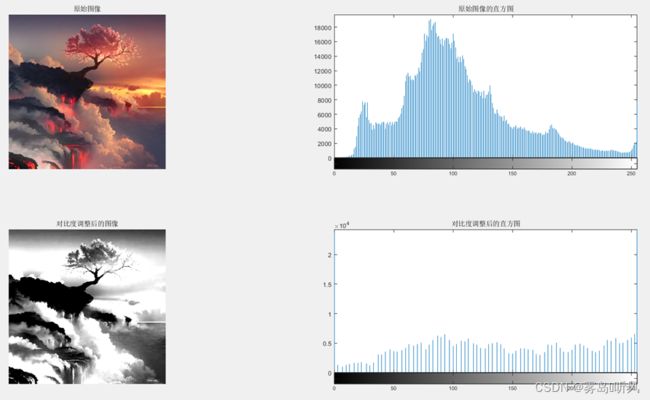
- 读入一幅图像,使用imadjust( )函数调整图像的对比度,并使用imhist( )函数显示原始图像和对比度调整后的图像的直方图
I = imread("3.png");
I1 = rgb2gray(I);
I2 = imadjust(I1,[0.2,0.5],[]);
subplot(221),imshow(I);title('原始图像');
subplot(222),imhist(I);title('原始图像的直方图');
subplot(223),imshow(I2);title('对比度调整后的图像');
subplot(224),imhist(I2);title('对比度调整后的直方图');
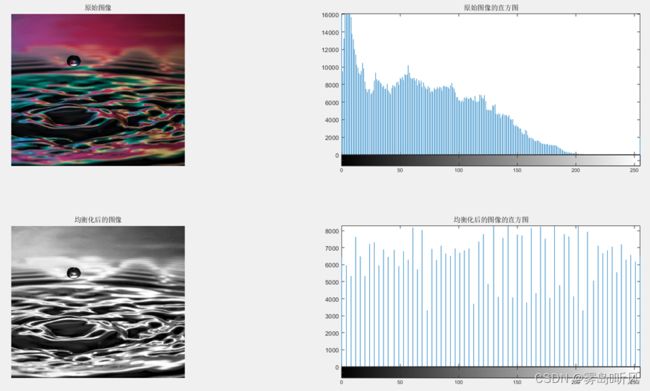
- 读入一幅图像,使用histeq( )函数均衡化图像,并使用imhist( )函数显示原始图像和均衡化后的图像的直方图
I = imread("4.png");
I1 = rgb2gray(I);
I2 = histeq(I1);
subplot(221),imshow(I);title('原始图像');
subplot(222),imhist(I);title('原始图像的直方图');
subplot(223),imshow(I2);title('均衡化后的图像');
subplot(224),imhist(I2);title('均衡化后的图像的直方图');
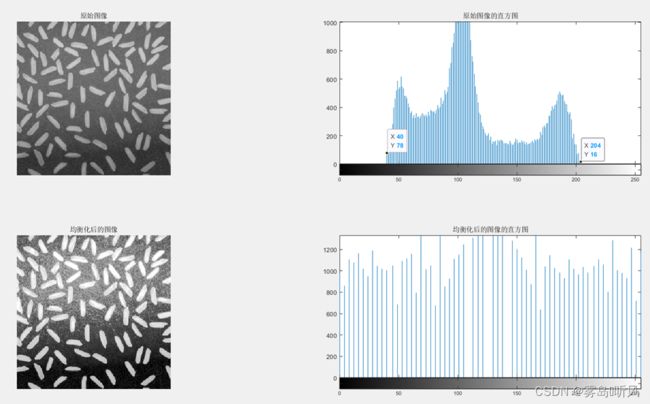
- 已知图像rice.png的灰度范围为[40,204],经线性变换后的图像的灰度范围扩展至[0,255],使用imhist( )函数显示原始图像和均衡化后的图像的直方图
I = imread("rice.png");
m = 40,n = 204,v = 0,u = 255;
I1 = (u-v)/(n-m)*[I-m]+v;
I2 = histeq(I1);
subplot(221),imshow(I);title('原始图像');
subplot(222),imhist(I);title('原始图像的直方图');
subplot(223),imshow(I2);title('均衡化后的图像');
subplot(224),imhist(I2);title('均衡化后的图像的直方图');
- 读入一幅图像,进行离散余弦变换,并对其进行离散余弦反变换
img = imread('1.png');
img1 = rgb2gray(img);
img2 = dct2(img1);
img3 = (idct2(img2))/255;
subplot(131);imshow(img);title('原始图像');
subplot(132);imshow(log(abs(img2)),[]),colormap(jet),colorbar;title('离散余弦变换');
subplot(133);imshow(img3);title('离散余弦反变换图像');
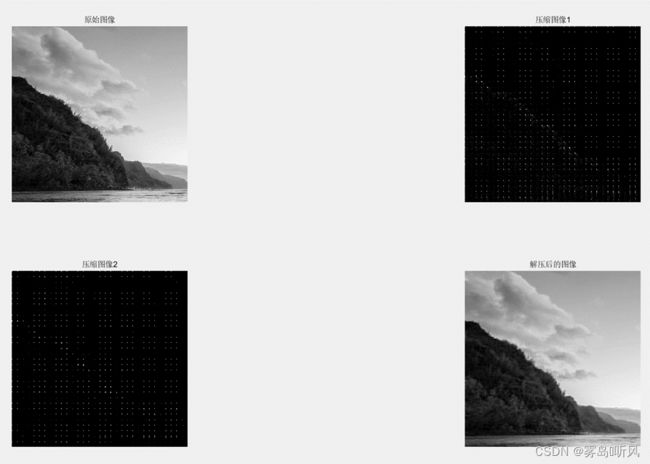
- 读入一幅图像,先将图像分解为16×16个数据块,然后分别对分解后的每个数据小方块进行DCT及IDCT变换,保留左上角15个系数进行处理
I = imread('2.tif');
I = rgb2gray(I);
I1 = double(I)/255;
T = dctmtx(16);
B = blkproc(I1,[16,16],'P1*x*P2',T,T');
mask = [1 1 1 1 1 0 0 0 0 0 0 0 0 0 0 0
        1 1 1 1 0 0 0 0 0 0 0 0 0 0 0 0
        1 1 1 0 0 0 0 0 0 0 0 0 0 0 0 0
        1 1 0 0 0 0 0 0 0 0 0 0 0 0 0 0
        1 0 0 0 0 0 0 0 0 0 0 0 0 0 0 0
        0 0 0 0 0 0 0 0 0 0 0 0 0 0 0 0
        0 0 0 0 0 0 0 0 0 0 0 0 0 0 0 0
        0 0 0 0 0 0 0 0 0 0 0 0 0 0 0 0
        0 0 0 0 0 0 0 0 0 0 0 0 0 0 0 0
        0 0 0 0 0 0 0 0 0 0 0 0 0 0 0 0
        0 0 0 0 0 0 0 0 0 0 0 0 0 0 0 0
        0 0 0 0 0 0 0 0 0 0 0 0 0 0 0 0
        0 0 0 0 0 0 0 0 0 0 0 0 0 0 0 0
        0 0 0 0 0 0 0 0 0 0 0 0 0 0 0 0
        0 0 0 0 0 0 0 0 0 0 0 0 0 0 0 0
        0 0 0 0 0 0 0 0 0 0 0 0 0 0 0 0];
B2 = blkproc(B,[16,16],'P1.*x', mask);
I2 = blkproc(B2,[16,16],'P1*x*P2',T',T);
subplot(221),imshow(I);title('原始图像');
subplot(222),imshow(B);title('压缩图像1');
subplot(223),imshow(B2);title('原始图像2');
subplot(224),imshow(I2);title('解压后的图像');
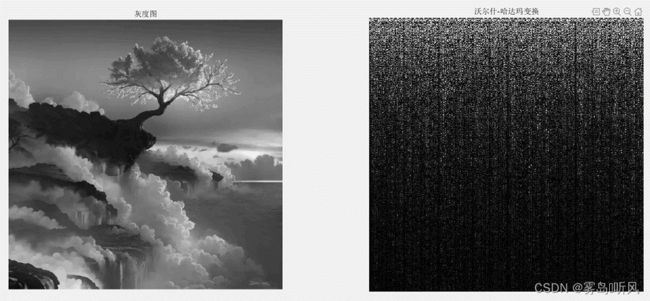
- 读入一幅图像,进行沃尔什-哈达玛变换
rgb = imread('22.jpeg');
gray = rgb2gray(rgb);
I = dct2(gray,[512,512]);
[m,n] = size(I);
for k=1:n
    wht(:,k) = hadamard(m)*I(:,k)/m;
end
for j=1:m
    wh(:,j) = hadamard(n)*I(:,j)/n;
end

wh=wh';
subplot(121);imshow(gray);title('灰度图');
subplot(122);imshow(wh);title('沃尔什-哈达玛变换');
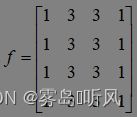
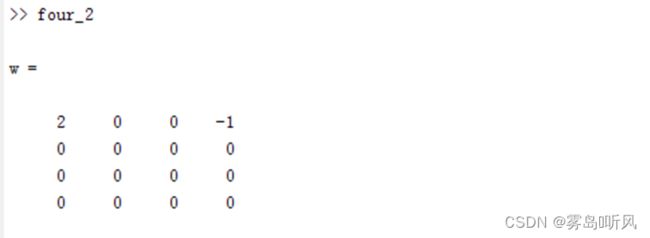
f = [1 3 3 1
    1 3 3 1
    1 3 3 1
    1 3 3 1];
g = [1 1 1 1
    1 1 -1 -1
    1 -1 1 -1
    1 -1 -1 1];
w = g*f*g/16;
w;
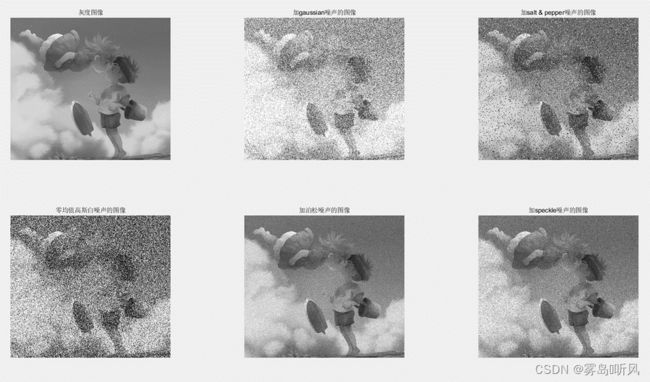
- 读入一幅图像,分别加入高斯白噪声、椒盐噪声、零均值高斯白噪声、泊松噪声、乘性噪声
I = imread('1.png');
I1 = rgb2gray(I);
I2 = imnoise(I1,'gaussian',0.2,0.05);
I3 = imnoise(I1,'salt & pepper',0.1);
I4 = imnoise(I1,'localvar',ones(size(I1))*0.1);
I5 = imnoise(I1,'poisson');
I6 = imnoise(I1,'speckle',0.02);
subplot(231);imshow(I1),title('灰度图像');
subplot(232);imshow(I2);title('加gaussian噪声的图像');
subplot(233);imshow(I3);title('加salt & pepper噪声的图像');
subplot(234);imshow(I4);title('零均值高斯白噪声的图像');
subplot(235);imshow(I5);title('加泊松噪声的图像');
subplot(236);imshow(I6);title('加speckle噪声的图像');
- 运行结果
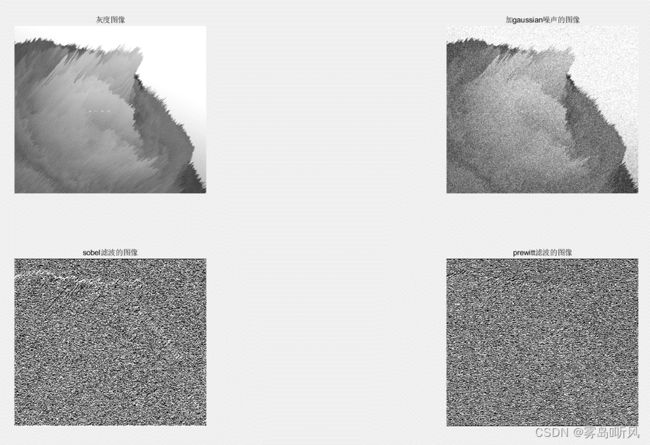
- 读入一幅图像,加入高斯白噪声后,分别进行sobel滤波、prewitt滤波
pic = rgb2gray(imread('2.png'));
pic1 = imnoise(pic,'gaussian');
pic2 = filter2(fspecial('sobel'),pic1,"same");
pic3 = filter2(fspecial('prewitt'),pic2,"valid");
subplot(221);imshow(pic),title('灰度图像');
subplot(222);imshow(pic1);title('加gaussian噪声的图像');
subplot(223);imshow(pic2);title('sobel滤波的图像');
subplot(224);imshow(pic3);title('prewitt滤波的图像');
- 读入一幅图像,加入椒盐噪声后,分别进行均值滤波、中值滤波
I = rgb2gray(imread('3.png'));
I1 = imnoise(I,'salt & pepper',0.1);
I2 = filter2((fspecial('average')),I1,'same');
I3 = medfilt2(I1);
subplot(221);imshow(I),title('灰度图像');
subplot(222);imshow(I1);title('加salt & pepper噪声的图像');
subplot(223);imshow(I2/255);title('均值滤波的图像');
subplot(224);imshow(I3);title('中值滤波的图像');
- 运行结果
- 读入一幅图像,加入高斯白噪声后,分别进行拉普拉斯滤波、高斯拉普拉斯滤波
P = rgb2gray(imread('4.png'));
P1 = imnoise(P,'gaussian');
P2 = filter2(fspecial('laplacian',0.1),P1,"same");
P3 = filter2(fspecial('log',4,0.3),P1,"same");
subplot(221);imshow(P),title('灰度图像');
subplot(222);imshow(P1);title('加高斯白噪声的图像');
subplot(223);imshow(P2);title('拉普拉斯滤波的图像');
subplot(224);imshow(P3);title('高斯拉普拉斯滤波的图像');
- 运行结果
- 读入一幅图像,加入椒盐噪声后,分别进行高斯低通滤波、模糊滤波
F = rgb2gray(imread('5.png'));
F1 = imnoise(F,'salt & pepper',0.1);
F2 = filter2(fspecial('gaussian',4,0.3),F1,'same');
F3 = filter2(fspecial('unsharp',0.3),F1,'same');
subplot(221);imshow(F),title('灰度图像');
subplot(222);imshow(F1);title('加椒盐噪声的图像');
subplot(223);imshow(F2/255);title('高斯低通滤波的图像');
subplot(224);imshow(F3);title('模糊滤波的图像');
- 运行结果
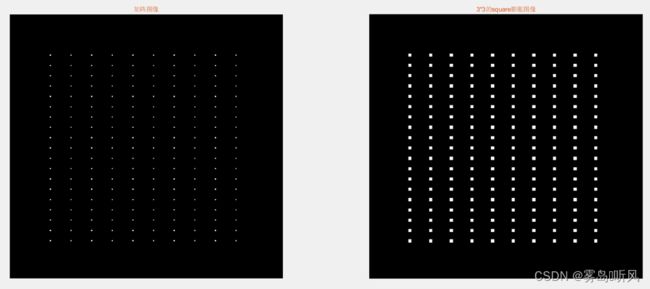
- 创建一个包含矩形对象的二值图像矩阵,使用一个3×3的正方形结构元素对象对创建的图像进行膨胀
img = zeros(256,265);
img(40:10:220,40:20:220)=1;
subplot(121);imshow(img);title('矩阵图像','Color','#D95319');
se = strel('square',3);
I = imdilate(img,se);
subplot(122),imshow(I),title('3*3的square膨胀图像','Color','#D95319');
- 读入一幅图像,先进行二值化转化,然后使用任意形状的构造元素对象对二值化图像进行腐蚀
I = imread('1.png');
subplot(131),imshow(I),title('原始图像','Color', '#D95319');
I1 = im2bw(I);
subplot(132),imshow(I1),title('二值图像','Color','#D95319');
se = strel('arbitrary',[[0 1 0],[1 1 1],[0 1 0]]);
I2 = imerode(I1,se);
subplot(133),imshow(I2),title('任意形状的构造元素进行腐蚀后的图像','Color','#D95319');
- 读入一幅图像,使用translate函数和imdilate函数对图像进行平移
I = imread('1.png');
se = translate(strel(1), [60 60]);
I2 = imdilate(I,se);
subplot(121);imshow(I), title('原始图像','Color', '#D95319')
subplot(122), imshow(I2), title('移动后的图像','Color', '#D95319');
- 读入一幅图像, 使用方形和圆形元素分别对图像进行膨胀和腐蚀
I = imread('1.png');
subplot(231),imshow(I),title('原始图像','Color', '#D95319');
I1 = im2bw(I);
subplot(232),imshow(I1),title('二值图像','Color','#D95319');
se = strel('square',20);
I2 = imdilate(I1,se);
subplot(233),imshow(I2),title('square的膨胀图像','Color','#D95319');
se1 = strel('disk',10);
I3 = imdilate(I1,se1);
subplot(234),imshow(I3),title('disk的膨胀图像','Color','#D95319');
se2 = strel('square',10);
I4 = imdilate(I1,se2);
subplot(235),imshow(I4),title('square的腐蚀图像','Color','#D95319');
se3 = strel('disk',20);
I5 = imerode(I1,se3);
subplot(236),imshow(I5),title('disk的腐蚀图像','Color','#D95319');
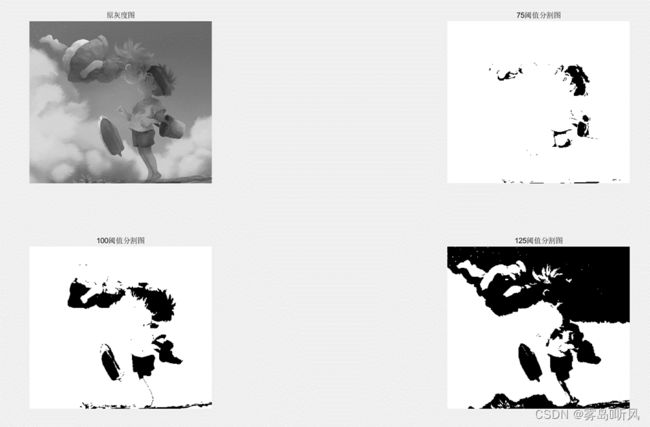
- 读入一幅彩色图像,将其转化为灰度图像,然后利用阈值分割法对灰度图像进行分割。(阈值T=75、100、125)
img = imread('1.png');
gray=rgb2gray(img);
gray2=rgb2gray(img);
gray3=rgb2gray(img);
subplot(221);imshow(gray);title('原灰度图');
[m,n] = size(gray);
a = 75;
for i=1:m
    for j=1:n
        if double(gray(i,j))>a
            gray(i,j)=255;
        end
        if double(gray(i,j))<=a
            gray(i,j)=0;
        end
    end
end
subplot(222);imshow(gray);title('75阈值分割图');
a= 100;
for i=1:m
    for j=1:n
        if double(gray2(i,j))>a
            gray2(i,j)=255;
        end
        if double(gray2(i,j))<=a
            gray2(i,j)=0;
        end
    end
end
subplot(223);imshow(gray2);title('100阈值分割图');
a= 125;
for i=1:m
    for j=1:n
        if double(gray3(i,j))>a
            gray3(i,j)=255;
        end
        if double(gray3(i,j))<=a
            gray3(i,j)=0;
        end
    end
end
subplot(224);imshow(gray3);title('125阈值分割图');
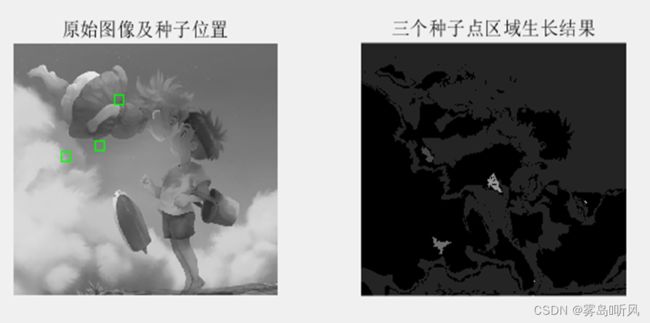
- 读入一幅彩色图像,将其转化为灰度图像,然后利用区域生长法对灰度图像进行分割
img = imread('1.png');
gray = rgb2gray(img);
subplot(121);imshow(gray);title('gray');
[n,m]=size(gray)
seedx=[256,128,210];
seedy=[128,256,230];
hold on
plot(seedx,seedy,'gs','linewidth',1);
title('原始图像及种子位置');
f=double(gray);
markerim=f==f(seedy(1),seedx(1));
for i=2:length(seedx)
    markerim=markerim|(f==f(seedy(i),seedx(i)));
end
thresh=[15,10,15];
maskim=zeros(size(f));
for i=1:length(seedx)
    g=abs(f-f(seedy(i),seedx(i)))<=thresh(i);
    maskim=maskim|g;
end
[g,nr]=bwlabel(imreconstruct(markerim,maskim),8);
g=mat2gray(g);
subplot(122);imshow(g);title('三个种子点区域生长结果');
- 读入一幅彩色图像,将其转化为灰度图像,然后利用分裂合并法对灰度图像进行分割
I = imread('1.png');
J = rgb2gray(I);
subplot(131),imshow(I),title('原图');
I1 = imresize(J,[512,512]);

subplot(132),imshow(J),title('灰度图');

S = qtdecomp(I1,.27);
blocks = repmat(uint8(0),size(S));

for dim = [512 256 128 64 32 16 8 4 2 1];
  numblocks = length(find(S==dim));
  if (numblocks > 0)
    values = repmat(uint8(1),[dim dim numblocks]);
    values(2:dim,2:dim,:) = 0;
    blocks = qtsetblk(blocks,S,dim,values);
  end
end

blocks(end,1:end) = 1;
blocks(1:end,end) = 1;
subplot(133),imshow(blocks,[]),title('分裂合并分割图');
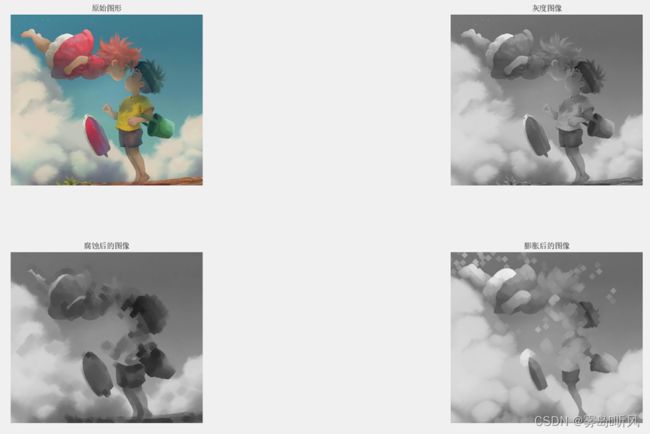
- 读入一幅彩色图像,先将其转化为灰度图像,然后使用菱形结构元素对灰度图像进行腐蚀和膨胀
clc;clear;close all;
I = imread("1.png");
subplot(221),imshow(I),title("原始图形");
I1 = rgb2gray(I);
subplot(222),imshow(I1),title("灰度图像");
se = strel('diamond',10);
I2 = imerode(I1,se);
subplot(223),imshow(I2),title("腐蚀后的图像");
I3 = imdilate(I1,se);
subplot(224),imshow(I3),title("膨胀后的图像");
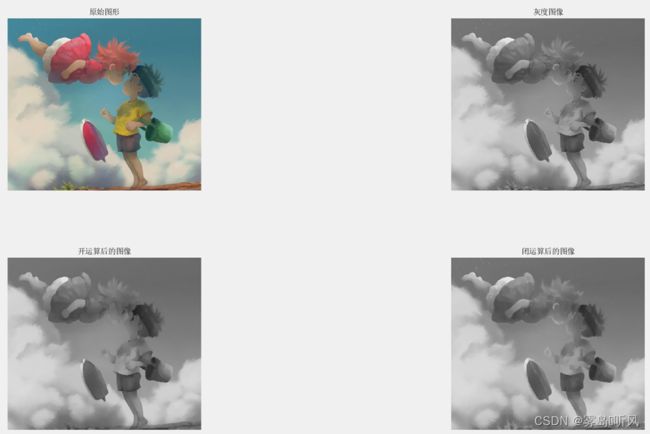
- 读入一幅彩色图像,先将其转化为灰度图像,然后使用矩形结构元素对灰度图像进行开运算和闭运算
clc;clear;close all;
I = imread("1.png");
subplot(221),imshow(I),title("原始图形");
I1 = rgb2gray(I);
subplot(222),imshow(I1),title("灰度图像");
se = strel("rectangle",[10 5]);
I2 = imopen(I1,se);
subplot(223),imshow(I2),title("开运算后的图像");
I3 = imclose(I1,se);
subplot(224),imshow(I3),title("闭运算后的图像");
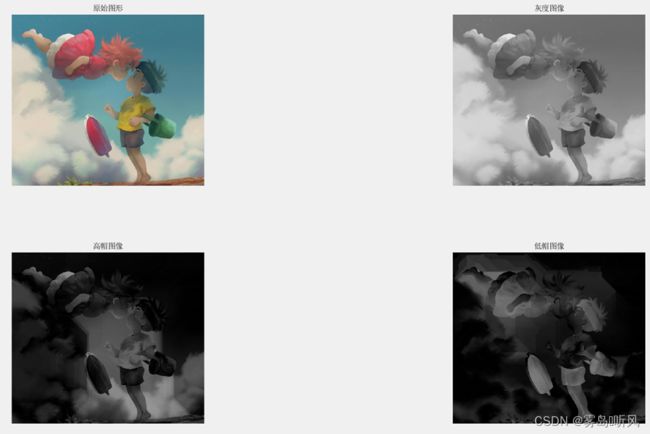
- 读入一幅彩色图像,先将其转化为灰度图像,然后使用圆形结构元素对灰度图像进行高帽变换和低帽变换
clc;clear;close all;
I = imread("1.png");
subplot(221),imshow(I),title("原始图形");
I1 = rgb2gray(I);
subplot(222),imshow(I1),title("灰度图像");
se = strel('disk',100);
I2 = imtophat(I1,se);
subplot(223),imshow(I2),title("高帽图像");
I3 = imbothat(I1,se);
subplot(224),imshow(I3),title("低帽图像");
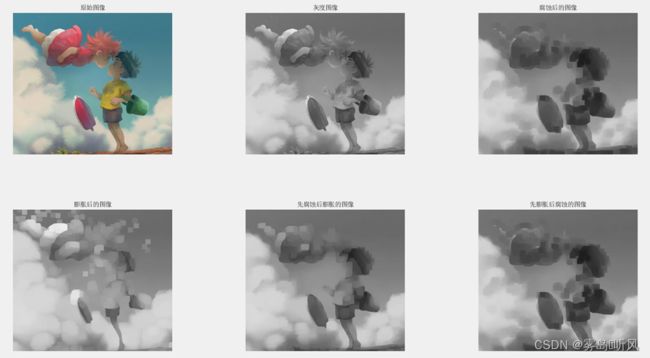
- 读入一幅彩色图像,先将其转化为灰度图像,然后对灰度图像进行“先腐蚀后膨胀”和“先膨胀后腐蚀”
clc;clear;close;
I = imread("1.png");
subplot(231),imshow(I),title('原始图像');
I1 = rgb2gray(I);
subplot(232),imshow(I1),title('灰度图像');
se = strel('square',20);
I2 = imerode(I1,se);
subplot(233),imshow(I2),title('腐蚀后的图像');
I3 = imdilate(I1,se);
subplot(234),imshow(I3),title('膨胀后的图像');
I4 = imdilate(I2,se);
subplot(235),imshow(I4),title('先腐蚀后膨胀的图像');
I5 = imerode(I4,se);
subplot(236),imshow(I5),title('先膨胀后腐蚀的图像');
- 读入一幅彩色图像,先将其转化为灰度图像,再将灰度图像转换为二值图像,然后对二值图像进行填充操作
clc;clear;close;
I = imread("1.png");
subplot(221),imshow(I),title('原始图像');
I1 = rgb2gray(I);
subplot(222),imshow(I1),title('灰度图像');
I2 = im2bw(I1);
subplot(223),imshow(I2),title('二值图像');
I3 = imfill(I2,"holes");
subplot(224),imshow(I3),title("填充图像");
图像处理的图片来源于网络热图,选取之前均进行过截取,缩放等(非原图),处理均属操作需要,图片仅用于代码代码操作者参考。如有侵权,请联系本人予以删除! ↩︎
