tsar-性能监控工具
简介
tsar是淘宝自己开发的一个采集工具,主要用来收集服务器的系统信息(如cpu,io,mem,tcp等),以及应用数据(如squid haproxy nginx等)。收集到的数据存储在磁盘上,可以随时查询历史信息,输出方式灵活多样,另外支持将数据存储到mysql中,也可以将数据发送到nagios报警服务器。tsar在展示数据时,可以指定模块,并且可以对多条信息的数据进行merge输出,带–live参数可以输出秒级的实时信息。
总体架构
Tsar是基于模块化设计的程序,程序有两部分组成:框架和模块。
框架程序源代码主要在src目录,而模块源代码主要在modules目录中。
框架提供对配置文件的解析,模块的加载,命令行参数的解析,应用模块的接口对模块原始数据的解析与输出。 模块提供接口给框架调用。
tsar依赖与cron每分钟执行采集数据,因此它需要系统安装并启用crond,安装后,tsar每分钟会执行tsar –cron来定时采集信息,并且记录到原始日志文件。
环境安装
wget -O tsar.zip https://github.com/alibaba/tsar/archive/master.zip --no-check-certificate

unzip tsar.zip

cd tsar

make

make install
环境配置
1、/etc/cron.d/tsar
[root@localhost ~]# cat /etc/cron.d/tsar

MAILTO=""

* * * * * root /usr/bin/tsar --cron > /dev/null 2>&1
如上所示,/etc/cron.d/tsar里面负责每分钟以root用户的角色调用tsar命令来执行数据采集。
2、/etc/logrotate.d/tsar
[root@localhost ~]# cat /etc/logrotate.d/tsar

/var/log/tsar.data

{

monthly

rotate 120

create

nocompress

nodateext

notifempty

prerotate

/usr/bin/chattr -a /var/log/tsar.data

endscript

postrotate

/usr/bin/chattr +a /var/log/tsar.data

endscript

}
在日志文件轮转配置中,每个月会把tsar的本地存储进行轮转,此外这里也设定了数据在/var/log/tsar.data下
3、etc/tsar/tsar.conf
[root@localhost ~]# cat /etc/tsar/tsar.conf

debug_level ERROR

mod_cpu on

mod_mem on

mod_swap on

mod_tcp on

mod_udp on

mod_traffic on

mod_io on

mod_pcsw on

mod_partition on

mod_tcpx on

mod_load on

mod_apache off

mod_lvs off

mod_haproxy off

mod_squid off

mod_nginx off

mod_swift off

mod_swift_code off

mod_swift_domain off

mod_swift_esi off

mod_swift_fwd off

mod_swift_store off

mod_swift_swapdir off

mod_swift_purge off

mod_swift_sys off

mod_swift_tcmalloc off

mod_tmd off

mod_percpu off

mod_tcprt off

mod_proc off pidname

mod_pharos off

mod_tmd4 off

mod_keyserver off

output_interface file

output_file_path /var/log/tsar.data

output_stdio_mod mod_swap,mod_partition,mod_cpu,mod_mem,mod_lvs,mod_haproxy,mod_traffic,mod_squid,mod_load,mod_tcp,mod_udp,mod_tcpx,mod_apache,mod_pcsw,mod_io,mod_percpu

include /etc/tsar/conf.d/*.conf
/etc/tsar/tsar.conf 负责tsar的采集模块和输出的具体配置;在这里配置启用哪些模块,输出等内容。模块路径:/usr/local/tsar/modules,各个模块的动态库so文件;
[root@localhost modules]# ls -lt

total 1136

-rwxr-xr-x 1 root root 15472 Jul  3 22:06 mod_ts_err.so

-rwxr-xr-x 1 root root 14747 Jul  3 22:06 mod_ts_os.so

-rwxr-xr-x 1 root root 14772 Jul  3 22:06 mod_ts_storage.so

-rwxr-xr-x 1 root root 10606 Jul  3 22:06 mod_udp.so

-rwxr-xr-x 1 root root 15215 Jul  3 22:06 mod_ts_client.so

-rwxr-xr-x 1 root root 16195 Jul  3 22:06 mod_ts_codes.so

-rwxr-xr-x 1 root root 15241 Jul  3 22:06 mod_ts_conn.so

-rwxr-xr-x 1 root root 14633 Jul  3 22:06 mod_tcpx.so

-rwxr-xr-x 1 root root 16708 Jul  3 22:06 mod_tmd4.so

-rwxr-xr-x 1 root root 15627 Jul  3 22:06 mod_tmd.so

-rwxr-xr-x 1 root root 11658 Jul  3 22:06 mod_traffic.so

-rwxr-xr-x 1 root root 14969 Jul  3 22:06 mod_ts_cache.so

-rwxr-xr-x 1 root root 22694 Jul  3 22:06 mod_swift_swapdir.so

-rwxr-xr-x 1 root root 25332 Jul  3 22:06 mod_swift_sys.so

-rwxr-xr-x 1 root root 20436 Jul  3 22:06 mod_swift_tcmalloc.so

-rwxr-xr-x 1 root root 14065 Jul  3 22:06 mod_tcprt.so

-rwxr-xr-x 1 root root 13409 Jul  3 22:06 mod_tcp.so
命令介绍
在tsar的使用中,可以参考下面的帮助信息,完成对应的监控。
[root@localhost ~]# tsar -h

Usage: tsar [options]

Options:

   -check         查看最后一次的采集数据

   --check/-C     查看最后一次tsar的提醒信息,如:tsar --check / tsar --check --cpu --io

   --cron/-c      使用crond模式来进行tsar监控

   --interval/-i  指明tsar的间隔时间,默认单位分钟,带上--live参数则单位是秒

   --list/-L      列出启用的模块

   --live/-l      查看实时数据

   --file/-f      指定输入文件

   --ndays/-n     指定过去的数据天数,默认1天

   --date/-d      指定日期,YYYYMMDD或者n代表n天前

   --detail/-D    能够指定查看主要字段还是模块的所有字段

   --spec/-s      指定字段,tsar –cpu -s sys,util

Modules Enabled:

   --cpu               列出cpu相关的监控计数

   --mem               物理内存的使用情况

   --swap              虚拟内存的使用情况

   --tcp               TCP 协议 IPV4的使用情况

   --udp               UDP 协议 IPV4的使用情况

   --traffic           网络传出的使用情况

   --io                Linux IO的情况

   --pcsw              进程和上下文切换

   --partition         磁盘使用情况

   --tcpx              TCP 连接相关的数据参数

   --load              系统负载情况
CPU监控
tsar --cpu
如下所示,使用参数 --cpu 可以监控系统的cpu,参数 user 表示用户空间 cpu,sys内核空间 cpu 使用情况,wait 是 IO 对应的 cpu 使用情况,hirq , sirq 分别是硬件中断,软件中断的使用情况,util 是系统使用 cpu 的总计情况。下表的数据可以看出,当前系统已使用大约30%的cpu。
[root@localhost ~]# tsar --cpu

Time           -----------------------cpu----------------------

Time             user     sys    wait    hirq    sirq    util

23/08/15-21:25  23.59    1.71    0.11    0.00    2.68   27.98

23/08/15-21:30  24.11    1.62    0.12    0.00    2.72   28.46

23/08/15-21:35  25.34    1.84    0.09    0.00    2.95   30.13

23/08/15-21:40  23.67    1.64    0.20    0.00    2.59   27.91

23/08/15-21:45  26.20    1.90    0.26    0.00    2.94   31.04

user: 表示CPU执行用户进程的时间,通常期望用户空间CPU越高越好.
sys: 表示CPU在内核运行时间,系统CPU占用率高,表明系统某部分存在瓶颈.通常值越低越好.
wait: CPU在等待I/O操作完成所花费的时间.系统不应该花费大量时间来等待I/O操作,否则就说明I/O存在瓶颈.
hirq: 系统处理硬中断所花费的时间百分比.
sirq: 系统处理软中断所花费的时间百分比.
util: CPU总使用的时间百分比.
nice: 系统调整进程优先级所花费的时间百分比.
steal: 被强制等待(involuntary wait)虚拟CPU的时间,此时hypervisor在为另一个虚拟处理器服务.
ncpu: CPU的总个数.
CPU的占用率计算,都是根据/proc/stat计数器文件而来,stat 文件的内容基本格式是:
cpu  67793686 1353560 66172807 4167536491 2705057 0 195975 609768
cpu0 10529517 944309 11652564 835725059 2150687 0 74605 196726
cpu1 14380773 127146 13908869 832565666 150815 0 31780 108418
cpu是总的信息,cpu0,cpu1等是各个具体cpu的信息,共有8个值,单位是ticks,分别是
User time, 67793686
Nice time, 1353560
System time, 66172807
Idle time, 4167536491
Waiting time, 2705057
Hard Irq time, 0
SoftIRQ time, 195975
Steal time, 609768
CPU总时间=user+system+nice+idle+iowait+irq+softirq+Stl
各个状态的占用=状态的cpu时间%CPU总时间*100%
比较特殊的是CPU总使用率的计算(util),目前的算法是:
util = 1 - idle - iowait - steal
MEM监控
tsar --mem
[root@localhost ~]# tsar --mem

Time           -----------------------mem----------------------

Time             free    used    buff    cach   total    util

23/08/15-21:25   2.1G    5.7G    0.00  164.0M    8.0G   71.44

23/08/15-21:30   2.1G    5.7G    0.00  181.4M    8.0G   71.43

23/08/15-21:35   2.1G    5.7G    0.00  213.9M    8.0G   71.42

23/08/15-21:40   2.1G    5.7G    0.00  233.8M    8.0G   71.43

23/08/15-21:45   1.4G    5.7G    0.00  924.6M    8.0G   71.43

23/08/15-21:50   1.4G    5.7G    0.00  889.4M    8.0G   71.42

free: 空闲的物理内存的大小
used: 已经使用的内存大小
buff: buff使用的内存大小
cach: 操作系统会把经常访问的东西放在cache中加快执行速度
total: 系统总的内存大小
util: 内存使用率
内存的计数器在/proc/meminfo,里面有一些关键项
MemTotal:      7680000 kB
MemFree:        815652 kB
Buffers:       1004824 kB
Cached: 4922556 kB内存使用率的计算算法:util = (total - free - buff - cache) / total * 100%
LOAD监控
tsar --load
[root@localhost ~]# tsar --load

Time           -------------------load-----------------

Time            load1   load5  load15    runq    plit

23/08/15-21:30   1.32    1.37    1.38    2.00   12.4K

23/08/15-21:35   1.20    1.29    1.34   21.00   12.4K

23/08/15-21:40   1.28    1.25    1.31    2.00   12.4K

23/08/15-21:45   1.44    1.26    1.29    3.00   12.4K

23/08/15-21:50   1.54    1.30    1.29    3.00   12.4K

23/08/15-21:55   0.94    1.36    1.34    4.00   12.4K

23/08/15-22:00   1.10    1.32    1.33    4.00   12.5K

load1: 一分钟的系统平均负载
load5: 五分钟的系统平均负载
load15:十五分钟的系统平均负载
runq: 在采样时刻,运行队列的任务的数目,与/proc/stat的procs_running表示相同意思
plit: 在采样时刻,系统中活跃的任务的个数(不包括运行已经结束的任务)
/proc/loadavg 文件中保存的有负载相关的数据
0.00 0.01 0.00 1/271 23741分别是1分钟负载,五分钟负载,十五分钟负载,运行进程/总进程,最大的pid
只需要采集前五个数据既可得到所有信息
注意:只有当系统负载除cpu核数>1的时候,系统负载较高
IO监控
tsar --io
[root@localhost ~]# tsar --io

Time           ------------------------------------------sda-------------------------------------------

Time            rrqms   wrqms      rs      ws   rsecs   wsecs  rqsize  qusize   await   svctm    util

23/08/15-21:25   0.28    3.4K  184.40  389.25    4.9K   15.0K   35.47    3.00    6.35    0.29   16.44

23/08/15-21:30   0.00    3.2K  109.71  382.74    2.5K   14.5K   35.27    3.00    7.33    0.30   14.68

23/08/15-21:35   0.15    3.1K  156.91  342.16    3.8K   13.8K   36.15    3.00    6.60    0.29   14.37

23/08/15-21:40   0.86    3.3K  234.00  371.43    6.9K   14.6K   36.43    3.00    5.93    0.28   16.83

23/08/15-21:45   0.72    3.4K  376.80  357.13   11.7K   14.8K   37.03    3.00    4.84    0.25   18.50

rrqms:每秒合并到设备的读取请求数
wrqms:每秒合并到设备的写入请求数
rs:每秒向设备发出的读取请求数
ws:每秒向设备发出的写入请求数
rsecs: 每秒从设备读取的扇区数
wsecs:每秒写入设备的扇区数
rqsize:发送到设备的请求的平均大小(以扇区为单位)
qusize:发送到设备的请求的平均队列长度
wait:向要服务的设备发出I/O请求的平均时间(以毫秒为单位)
svctm:发出到设备的I/O请求的平均服务时间(以毫秒为单位)
util:向设备发出I/O请求的CPU时间百分比
IO的计数器文件是: /proc/diskstats,比如:
 202    0 xvda 12645385 1235409 416827071 59607552 193111576 258112651 3679534806 657719704 0 37341324 717325100
 202    1 xvda1 421 2203 3081 9888 155 63 421 1404 0 2608 11292

每一行字段的含义是:
major: 主设备号
minor: 次设备号,设备号是用来区分磁盘的类型和厂家信息
name: 设备名称
rd_ios: 读完成次数
rd_merges: 合并读完成次数,为了效率可能会合并相邻的读和写.从而两次4K的读在它最终被处理到磁盘上之前可能会变成一次8K的读,才被计数(排队),因此只有一次I/O操作
rd_sectors: 读扇区的次数
rd_ticks: 读花费的毫秒数
wr_ios: 写完成次数
wr_merges: 合并写完成次数
wr_sectors: 写扇区次数
wr_ticks: 写花费的毫秒数
cur_ios: 正在处理的输入/输出请求数
ticks: 输入/输出操作花费的毫秒数
aveq: 输入/输出操作花费的加权毫秒数
通过这些计数器可以算出来上面的每个字段的值
double n_ios = rd_ios + wr_ios;
double n_ticks = rd_ticks + wr_ticks;
double n_kbytes = (rd_sectors + wr_sectors) / 2;
st_array[0] = rd_merges / (inter * 1.0);
st_array[1] = wr_merges / (inter * 1.0);
st_array[2] = rd_ios / (inter * 1.0);
st_array[3] = wr_ios / (inter * 1.0);
st_array[4] = rd_sectors / (inter * 2.0);
st_array[5] = wr_sectors / (inter * 2.0);
st_array[6] = n_ios ? n_kbytes / n_ios : 0.0;
st_array[7] = aveq / (inter * 1000);
st_array[8] = n_ios ? n_ticks / n_ios : 0.0;
st_array[9] = n_ios ? ticks / n_ios : 0.0;
st_array[10] = ticks / (inter * 10.0); /* percentage! */
/*st_array分别代表tsar显示的每一个值*/
注意:
扇区一般都是512字节,因此有的地方除以2了
ws是指真正落到io设备上的写次数, wrqpms是指系统调用合并的写次数,它们之间的大小关系没有可比性,因为不知道多少请求能够被合并,比如发起了100个read系统调用,每个读4K,假如这100个都是连续的读,由于硬盘通常允许最大的request为256KB,那么block层会把这100个读请求合并成2个request,一个256KB,另一个144KB,rrqpm/s为100,因为100个request都发生了合并,不管它最后合并成几个;r/s为2,因为最后的request数为2 .
NET监控
tsar --traffic
[root@localhost ~]# tsar --traffic

Time           ---------------------traffic--------------------

Time            bytin  bytout   pktin  pktout  pkterr  pktdrp

23/08/15-21:30 548.5K  353.4K    1.0K    1.2K    0.00    0.00

23/08/15-21:35 762.4K  440.4K    1.2K    1.4K    0.00    0.00

23/08/15-21:40 540.2K  344.0K    1.0K    1.1K    0.00    0.00

23/08/15-21:45 640.3K  365.0K    1.1K    1.2K    0.00    0.00

23/08/15-21:50 564.4K  364.1K    1.1K    1.2K    0.00    0.00

23/08/15-21:55 599.8K  327.6K    1.1K    1.1K    0.00    0.00

bytin: 入口流量byte/s
bytout: 出口流量byte/s
pktin: 入口pkt/s
pktout: 出口pkt/s
流量的计数器信息来自:/proc/net/dev
face |bytes    packets errs drop fifo frame compressed multicast|bytes    packets errs drop fifo colls carrier compressed
lo:1291647853895 811582000    0    0    0     0          0         0 1291647853895 811582000    0    0    0     0       0          0
eth0:853633725380 1122575617    0    0    0     0          0         0 1254282827126 808083790    0    0    0     0       0          0
字段的含义第一行已经标示出来,每一行代表一个网卡,tsar主要采集的是出口和入口的bytes/packets
注意tsar只对以eth和em开头的网卡数据进行了采集,像lo这种网卡直接就忽略掉了,流量的单位是byte
tsar --tcp --udp
[root@localhost ~]# tsar --tcp --udp

Time           -------------------------------tcp------------------------------ ---------------udp--------------

Time           active  pasive    iseg  outseg  EstRes  AtmpFa  CurrEs  retran     idgm    odgm  noport  idmerr

23/08/15-00:05   0.79    1.52    1.6K    2.1K    0.00    0.03    3.4K    0.02     0.00    2.00    0.00    0.00

23/08/15-00:10   0.73    1.40  884.25  921.56    0.00    0.03    3.4K    0.01     0.00    3.00    0.00    0.00

23/08/15-00:15   0.77    1.46  959.62    1.0K    0.00    0.03    3.4K    0.01     0.00    3.00    0.00    0.00

23/08/15-00:20   0.69    1.43    1.0K    1.0K    0.00    0.03    3.4K    0.01     0.00    3.00    0.00    0.00

23/08/15-00:25   0.72    1.42    1.2K    1.1K    0.00    0.03    3.4K    0.00     0.00    3.00    0.00    0.00

TCP:
active:主动打开的tcp连接数目
pasive:被动打开的tcp连接数目
iseg: 收到的tcp报文数目
outseg:发出的tcp报文数目
EstRes:Number of resets that have occurred at ESTABLISHED
AtmpFa:Number of failed connection attempts
CurrEs:当前状态为ESTABLISHED的tcp连接数
retran:系统的重传率

UDP:
idgm: 收到的udp报文数目
odgm: 发送的udp报文数目
noport:udp协议层接收到目的地址或目的端口不存在的数据包
idmerr:udp层接收到的无效数据包的个数
tcp和udp的相关计数器文件是:/proc/net/snmp
Tcp: RtoAlgorithm RtoMin RtoMax MaxConn ActiveOpens PassiveOpens AttemptFails EstabResets CurrEstab InSegs OutSegs RetransSegs InErrs OutRsts
Tcp: 1 200 120000 -1 31702170 14416937 935062 772446 16 1846056224 1426620266 448823 0 5387732

Udp: InDatagrams NoPorts InErrors OutDatagrams
Udp: 31609577 10708119 0 159885874
我们主要关注其中的ActiveOpens/PassiveOpens/AttemptFails/EstabResets/CurrEstab/InSegs/OutSegs/RetransSegs
主要关注一下重传率的计算方式:retran = (RetransSegs-last RetransSegs) / (OutSegs-last OutSegs) * 100%
历史数据回溯
tsar -d 2 -i 1
通过参数-d 2 可以查出两天前到现在的数据,-i 1 表示以每次1分钟作为采集显示。
[root@localhost ~]# tsar -d 2 -i 1

Time           ---cpu-- ---mem-- ---tcp-- -----traffic---- --sda---  ---load-

Time             util     util   retran    bytin  bytout     util     load1

22/08/15-00:02 ------    71.40     0.03   754.2K  421.4K    14.38     1.59

22/08/15-00:03  34.55    71.41     0.01   773.7K  400.9K    13.39     1.42

22/08/15-00:04  31.80    71.41     0.03   708.6K  391.9K    12.88     1.54

22/08/15-00:05  28.70    71.40     0.00   544.5K  305.9K    11.32     1.68

22/08/15-00:06  25.83    71.41     0.02   521.1K  280.4K    13.32     1.48

22/08/15-00:07  25.68    71.42     0.00   495.0K  265.2K    12.08     1.21

22/08/15-00:08  30.89    71.41     0.01   811.0K  280.1K    14.92     0.92

22/08/15-00:09  23.83    71.41     0.03   636.7K  349.4K    11.81     1.47
实时数据查看
tsar -l -i 1
通过参数 -l 可以查看实时采集数据,-i 1 表示以每1s作为采集显示。
[root@localhost ~]# tsar -li 1
Time ---cpu-- ---mem-- ---tcp-- -----traffic---- --sda--- ---load-
Time util util retran bytin bytout util load1
26/09/23-17:11:03 38.49 36.90 0.01 17.7M 10.1M 6.60 17.47
26/09/23-17:11:04 28.03 36.90 0.00 30.4M 20.5M 3.90 17.47
26/09/23-17:11:05 17.47 36.89 0.01 8.5M 15.3M 0.50 17.47
26/09/23-17:11:06 14.41 36.89 0.01 9.4M 10.8M 1.50 17.47
26/09/23-17:11:07 20.15 36.89 0.00 10.9M 14.0M 0.90 16.87
26/09/23-17:11:08 27.28 36.89 0.00 16.1M 12.5M 1.40 16.87
26/09/23-17:11:09 23.56 36.89 0.01 14.8M 12.7M 1.00 16.87
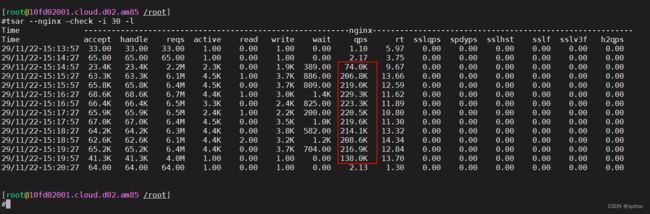
26/09/23-17:11:10 20.34 36.88 0.03 14.4M 17.6M 0.50 16.87Nginx监控
tsar --nginx --check -i 30 -l
通过参数 --nginx 可以查看nginx转发数据,-i 30 表示以每30s作为采集显示, -l 实时采集数据查看。