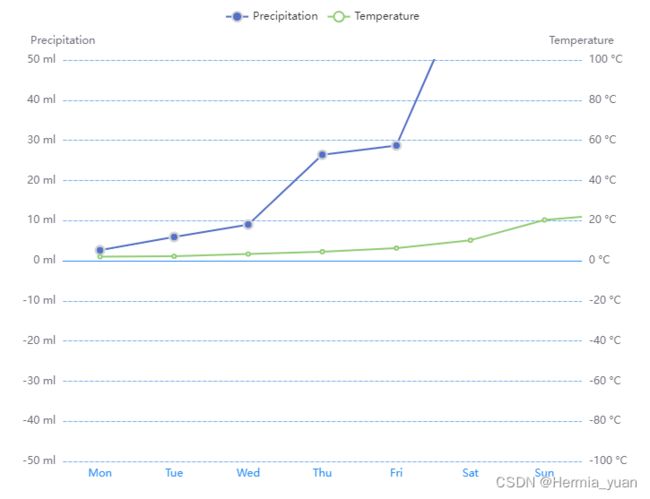
Echarts--------双折线图
设置smybol 拐点样式
option = {
  tooltip: {
    trigger: 'axis',
    axisPointer: {
      type: 'cross',
      crossStyle: {
        color: '#999'
      }
    }
  },
  legend: {
    data: ['Precipitation', 'Temperature']
  },
  xAxis: [
    {
      type: 'category',
      data: ['Mon', 'Tue', 'Wed', 'Thu', 'Fri', 'Sat', 'Sun'],
      axisPointer: {
        type: 'shadow'
      },
      axisTick:{
        show:false,
      },
      axisLine:{
      lineStyle: {
        onZero: true, //表示 X 轴或者 Y 轴的轴线是否在另一个轴的 0 刻度上,只有在另一个轴为数值轴且包含 0 刻度时有效。
        color: "rgba(43, 142, 243, 1)", //x轴轴线颜色 (底部)
      },

    },
    }
  ],
  yAxis: [
    {
      type: 'value',
      name: 'Precipitation',
      min: -50,
      max: 50,
      interval: 10,
      axisLabel: {
        formatter: '{value} ml'
      },
    },
    {
      type: 'value',
      name: 'Temperature',
      min:-100,
      max: 100,
      interval: 20,
      axisLabel: {
        formatter: '{value} °C'
      },
      splitLine: {
        show: true,
        lineStyle: {
          color: "rgba(43, 142, 243, 0.6)",
          type: "dashed", // 坐标轴背景虚线
        },
      },
    }
  ],
  series: [
    {
      name: 'Precipitation',
      type: 'line',
      tooltip: {
        valueFormatter: function (value) {
          return value + ' ml';
        }
      },
      data: [
        2.6, 5.9, 9.0, 26.4, 28.7, 70.7, 175.6, 182.2, 48.7, 18.8, 6.0, 2.3
      ],
      symbol:"circle",
      symbolSize:10,  // 拐点的大小
      smooth: false, //是否用曲线显示,
      itemStyle: {
        //下面是拐点样式配置属性
        // color:'#B756',//这里设置的拐点颜色
        borderColor: "#D3D3D3", //  拐点边框颜色
        borderWidth: 2, //  拐点边框宽度
        shadowColor: "#F5F5F5", //  阴影颜色
        shadowBlur: 1, //  阴影渐变范围控制
       },
    },
    {
      name: 'Temperature',
      type: 'line',
      yAxisIndex: 1,
      tooltip: {
        valueFormatter: function (value) {
          return value + ' °C';
        }
      },
      data: [2.0, 2.2, 3.3, 4.5, 6.3, 10.2, 20.3, 23.4, 23.0, 16.5, 12.0, 6.2]
    }
  ]
};