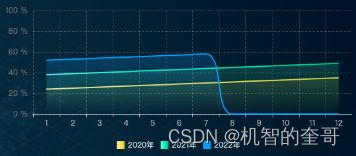
【Echart Bug记录】z / z2 / zlevel of displayable is invalid, which may cause unexpected errors
BUG:首将鼠标放在图表上时会出现此警告
解决方案
需要在 echarts 系列选项中声明“zlevel”和“z”属性。
series: [ { name: …, areaStyle…, itemStyle …, zlevel: 9 , z: 9, data: …, }
文档链接
series: [
              {
                name: newData.seriesData[0].year + '年',
                data: newData.seriesData[0].data,
                type: 'line',
                smooth: true,
                showSymbol: false,
                zlevel: 1,
                z: 1,
                lineStyle: {
                  width: 2,
                  color: new this.$echarts.graphic.LinearGradient(0, 1, 0, 0, [
                    {
                      offset: 0,
                      color: 'rgba(255, 241, 168, 1)',
                    },
                    {
                      offset: 0.5,
                      color: 'rgba(255, 225, 67, 1)',
                    },
                    {
                      offset: 1,
                      color: 'rgba(198, 202, 1, 1)',
                    },
                  ]),
                },
                areaStyle: {
                  color: new this.$echarts.graphic.LinearGradient(
                    0,
                    0,
                    0,
                    1,
                    [
                      {
                        offset: 0,
                        color: 'rgba(255, 214, 0, 0.18)',
                      },
                      {
                        offset: 1,
                        color: 'rgba(204, 255, 0, 0)',
                      },
                    ],
                    false
                  ),
                },
              },
              {
                name: newData.seriesData[1].year + '年',
                data: newData.seriesData[1].data,
                type: 'line',
                smooth: true,
                showSymbol: false,
                zlevel: 2,
                z: 2,
                lineStyle: {
                  width: 2,
                  color: new this.$echarts.graphic.LinearGradient(0, 1, 0, 0, [
                    {
                      offset: 0,
                      color: 'rgba(154, 255, 225, 1)',
                    },
                    {
                      offset: 0.5,
                      color: 'rgba(0, 255, 178, 1)',
                    },
                    {
                      offset: 1,
                      color: 'rgba(0, 172, 120, 1)',
                    },
                  ]),
                },
                areaStyle: {
                  color: new this.$echarts.graphic.LinearGradient(
                    0,
                    0,
                    0,
                    1,
                    [
                      {
                        offset: 0,
                        color: 'rgba(75, 255, 179, 0.25)',
                      },
                      {
                        offset: 1,
                        color: 'rgba(72, 255, 134, 0)',
                      },
                    ],
                    false
                  ),
                },
              },
              {
                name: newData.seriesData[2].year + '年',
                data: newData.seriesData[2].data,
                type: 'line',
                smooth: true,
                showSymbol: false,
                lineStyle: {
                  width: 2,
                  color: '#179DFF',
                },
                zlevel: 3,
                z: 3,
                areaStyle: {
                  color: new this.$echarts.graphic.LinearGradient(
                    0,
                    0,
                    0,
                    1,
                    [
                      {
                        offset: 0,
                        color: 'rgba(48, 156, 255, 0.3)',
                      },
                      {
                        offset: 1,
                        color: 'rgba(72, 167, 255, 0)',
                      },
                    ],
                    false
                  ),
                },
              },
            ],
