QT-qcustomPlot之绘图基本操作(二)
参考https://segmentfault.com/a/1190000021931918
一:背景色设置
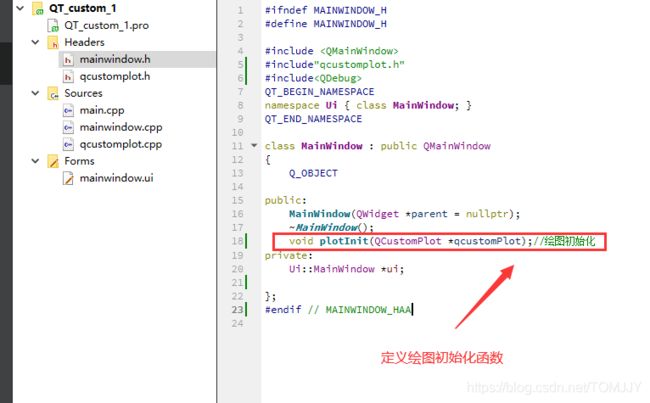
1、声明和定义绘图初始化函数,并在构造函数中调用


qcustomPlot->setBackground(plotGradient);
**setsetBackground(plotGradient)**中,setsetBackground函数是设置画图区的背景颜色,参数plotGradient是QLinearGradient类的实例化对象。而QLinearGradient是一个可设置线性渐变颜色的类。它的setStart(0, 0)方法用来设定渐变色的起点,setFinalStop(300, 350)设定渐变色终点,此处就表示从点(0,0)颜色渐变到点(300,350)。setColorAt(0, QColor(0, 0, 0))方法用来设定颜色。第一个参数为0表示起始点颜色,为1表示设置终点颜色,QColor(int,int,int)用来设置RGB颜色。
qcustomPlot->setBackground(plotGradient);
改为:
qcustomPlot->axisRect()->setBackground(plotGradient);
运行结果:即指定在坐标轴矩形内设置背景色

三:坐标轴风格的设置
   qcustomPlot->xAxis->setLabel("x轴");  //设置轴的名字
   qcustomPlot->xAxis->setTickLengthIn(1);       // 轴线内刻度的长度
   qcustomPlot->xAxis->setTickLengthOut(5);      // 轴线外刻度的长度
   qcustomPlot->xAxis>setUpperEnding(QCPLineEnding::esSpikeArrow);  // 结束时加个箭头
setLowerEnding设置轴线开始时的风格
   qcustomPlot->xAxis->grid()->setPen(QPen(QColor(140, 140, 140), 1, Qt::DotLine));     // 网格线(对应刻度)画笔
   qcustomPlot->yAxis->grid()->setPen(QPen(QColor(140, 140, 140), 1, Qt::DotLine));
   qcustomPlot->xAxis->grid()->setSubGridPen(QPen(QColor(80, 80, 80), 1, Qt::DotLine)); // 子网格线(对应子刻度)画笔
   qcustomPlot->yAxis->grid()->setSubGridPen(QPen(QColor(80, 80, 80), 1, Qt::DotLine));
   qcustomPlot->xAxis->grid()->setSubGridVisible(true);     // 显示子网格线
   qcustomPlot->yAxis->grid()->setSubGridVisible(true);
   qcustomPlot->xAxis->grid()->setZeroLinePen(QPen(Qt::blue));   // 设置刻度为0时的网格线的画笔
   qcustomPlot->yAxis->grid()->setZeroLinePen(QPen(Qt::blue));])
QPen pen;
   QStringList lineNames;
   lineNames << "lsNone" << "lsLine" << "lsStepLeft" << "lsStepRight" << "lsStepCenter" << "lsImpulse";

   for (int i = QCPGraph::lsNone; i <= QCPGraph::lsImpulse; ++i)
   {
       qcustomPlot->addGraph();
       pen.setColor(QColor(qSin(i*1+1.2)*80+80, qSin(i*0.3+0)*80+80, qSin(i*0.3+1.5)*80+80));
       qcustomPlot->graph()->setPen(pen);       // 设置图表的画笔
       qcustomPlot->graph()->setName(lineNames.at(i-QCPGraph::lsNone));
       qcustomPlot->graph()->setLineStyle((QCPGraph::LineStyle)i);  // 设置图表线段的风格
       qcustomPlot->graph()->setScatterStyle(QCPScatterStyle(QCPScatterStyle::ssCircle, 5));  // 设置图表散点图的样式,散点图的样式有很多种,可以自己试试

       QVector<double> x(15), y(15);
       for (int j=0; j<15; ++j)
       {
           x[j] = j/15.0 * 5*3.14 + 0.01;
           y[j] = 7*qSin(x[j])/x[j] - (i-QCPGraph::lsNone)*5 + (QCPGraph::lsImpulse)*5 + 2;
       }
       qcustomPlot->graph()->setData(x, y);
       qcustomPlot->graph()->rescaleAxes(true);//自适应坐标轴范围显示
   }


