python cartopy绘制北极/python绘图函数封装/python气象绘图
因为研究需要大量出图,于是将常用的绘图函数封装,提高绘图效率。
绘图函数
函数主要有两部分组成:
1、完成解决北极投影重叠的z_masked函数,详情参见python cartopy极地投影重叠解决
2、绘制极地投影的底图函数,并返回底图与绘图的x、y与vaule。
可以通过返回的图对象与坐标、值进行进一步的绘图。
def z_masked_overlap(axe, X, Y, Z, source_projection=None):
    """
    for data in projection axe.projection
    find and mask the overlaps (more 1/2 the axe.projection range)

    X, Y either the coordinates in axe.projection or longitudes latitudes
    Z the data
    operation one of 'pcorlor', 'pcolormesh', 'countour', 'countourf'

    if source_projection is a geodetic CRS data is in geodetic coordinates
    and should first be projected in axe.projection

    X, Y are 2D same dimension as Z for contour and contourf
    same dimension as Z or with an extra row and column for pcolor
    and pcolormesh

    return ptx, pty, Z
    """
    if not hasattr(axe, 'projection'):
        return Z
    if not isinstance(axe.projection, ccrs.Projection):
        return Z

    if len(X.shape) != 2 or len(Y.shape) != 2:
        return Z

    if (source_projection is not None and
            isinstance(source_projection, ccrs.Geodetic)):
        transformed_pts = axe.projection.transform_points(
            source_projection, X, Y)
        ptx, pty = transformed_pts[..., 0], transformed_pts[..., 1]
    else:
        ptx, pty = X, Y


    with np.errstate(invalid='ignore'):
        # diagonals have one less row and one less columns
        diagonal0_lengths = np.hypot(
            ptx[1:, 1:] - ptx[:-1, :-1],
            pty[1:, 1:] - pty[:-1, :-1]
        )
        diagonal1_lengths = np.hypot(
            ptx[1:, :-1] - ptx[:-1, 1:],
            pty[1:, :-1] - pty[:-1, 1:]
        )
        to_mask = (
            (diagonal0_lengths > (
                abs(axe.projection.x_limits[1]
                    - axe.projection.x_limits[0])) / 2) |
            np.isnan(diagonal0_lengths) |
            (diagonal1_lengths > (
                abs(axe.projection.x_limits[1]
                    - axe.projection.x_limits[0])) / 2) |
            np.isnan(diagonal1_lengths)
        )

        # TODO check if we need to do something about surrounding vertices

        # add one extra colum and row for contour and contourf
        if (to_mask.shape[0] == Z.shape[0] - 1 and
                to_mask.shape[1] == Z.shape[1] - 1):
            to_mask_extended = np.zeros(Z.shape, dtype=bool)
            to_mask_extended[:-1, :-1] = to_mask
            to_mask_extended[-1, :] = to_mask_extended[-2, :]
            to_mask_extended[:, -1] = to_mask_extended[:, -2]
            to_mask = to_mask_extended
        if np.any(to_mask):

            Z_mask = getattr(Z, 'mask', None)
            to_mask = to_mask if Z_mask is None else to_mask | Z_mask

            Z = ma.masked_where(to_mask, Z)

        return ptx, pty, Z
# 绘制极地投影:北极底图,返回图对象
def arcticplot(z_masked_overlap,lat,lon,value):
    mpl.rcParams["font.family"] = 'Arial'  #默认字体类型
    mpl.rcParams["mathtext.fontset"] = 'cm' #数学文字字体
    mpl.rcParams["font.size"] = 12   #字体大小
    mpl.rcParams["axes.linewidth"] = 1
    proj =ccrs.NorthPolarStereo(central_longitude=0)#设置地图投影
    #在圆柱投影中proj = ccrs.PlateCarree(central_longitude=xx)
    leftlon, rightlon, lowerlat, upperlat = (-180,180,60,90)#经纬度范围

    img_extent = [leftlon, rightlon, lowerlat, upperlat]
    fig1 = plt.figure(figsize=(12,10))#设置画布大小
    f1_ax1 = fig1.add_axes([0.2, 0.3, 0.5, 0.5],projection = ccrs.NorthPolarStereo(central_longitude=0))#绘制地图位置
    #注意此处添加了projection = ccrs.NorthPolarStereo(),指明该axes为北半球极地投影
    #f1_ax1.gridlines(crs=ccrs.PlateCarree(), draw_labels=True,
     #                 linewidth=1, color='grey',linestyle='--')
    f1_ax1.set_extent(img_extent, ccrs.PlateCarree())
    f1_ax1.add_feature(cfeature.COASTLINE.with_scale('110m'))
    g1=f1_ax1.gridlines(crs=ccrs.PlateCarree(), draw_labels=True, linewidth=1, color='gray',linestyle='--')
    X, Y, masked_MDT = z_masked_overlap(f1_ax1, lon, lat, value,
        source_projection=ccrs.Geodetic())
    g1.xlocator = mticker.FixedLocator(np.linspace(-180,180,13))
    g1.ylocator = mticker.FixedLocator(np.linspace(60, 90,4))

    theta = np.linspace(0, 2*np.pi, 100)
    center, radius = [0.5, 0.5], 0.44
    verts = np.vstack([np.sin(theta), np.cos(theta)]).T
    circle = mpath.Path(verts * radius + center)
    f1_ax1.set_boundary(circle, transform=f1_ax1.transAxes)
    return fig1,f1_ax1,X,Y,masked_MDT
其中,z_masked_overlap函数返回了正确绘制基地投影的坐标,arcticplot会绘制北极底图函数,可以看到,arcticplot返回了图与轴对象(fig1,f1_ax1),绘图坐标X、Y,和需要绘图的数据()masked_MDT)
示例
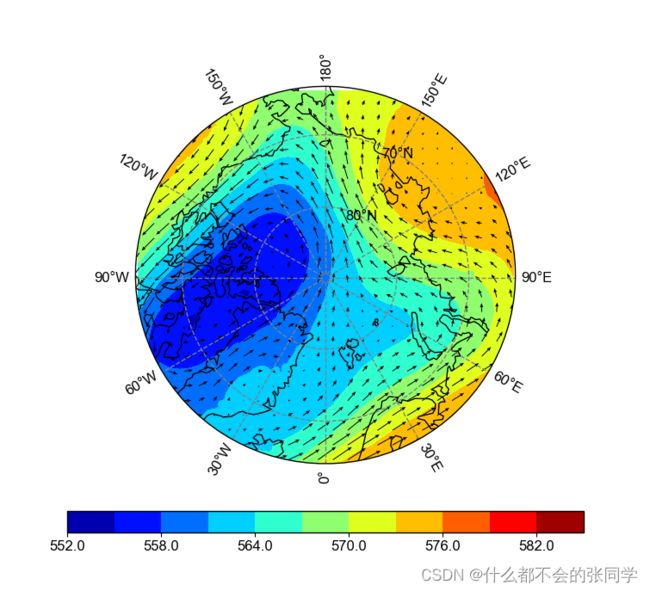
需要绘图时,我们只需要输入对应的坐标与绘图数据即可比如我要绘制2018北极夏季的500hPa位势与风场:
if __name__ == '__main__':

 fig,f1_ax1,x,y,masked_v=arcticplot(z_masked_overlap,lat2d,lon2d,ht_500/9.8)
 c7=f1_ax1.contourf(x, y, masked_v,cmap=cmaps.matlab_jet,levels=10)
 quiver = f1_ax1.quiver(x, y, u_500, v_500, pivot='tail',width=0.002, scale=200, color='black', headwidth=4,regrid_shape=30,alpha=1
在这里,使用返回的x,y绘制图像。
如果相对图进行进一步设置,可以直接使用返回的图与轴的进行进一步设置,比如添加色标:
position=fig.add_axes([0.2, 0.25, 0.5, 0.025])#图标位置
 font = {'family' : 'serif',
          'color'  : 'darkred',
          'weight' : 'normal',
          'size'   : 16,
          }
 cb=fig.colorbar(c7,cax=position,orientation='horizontal',format='%.1f',extend='both')#设置图标
 #cb.set_label('m',fontdict=font) #添加图标标签
 plt.show()
