Python海洋专题六之Cartopy画地形水深图
Python海洋专题六之Cartopy画地形水深图
海洋与大气科学
上期读取nc水深文件,并出图
但是存在一些不完美,本期修饰
本期内容
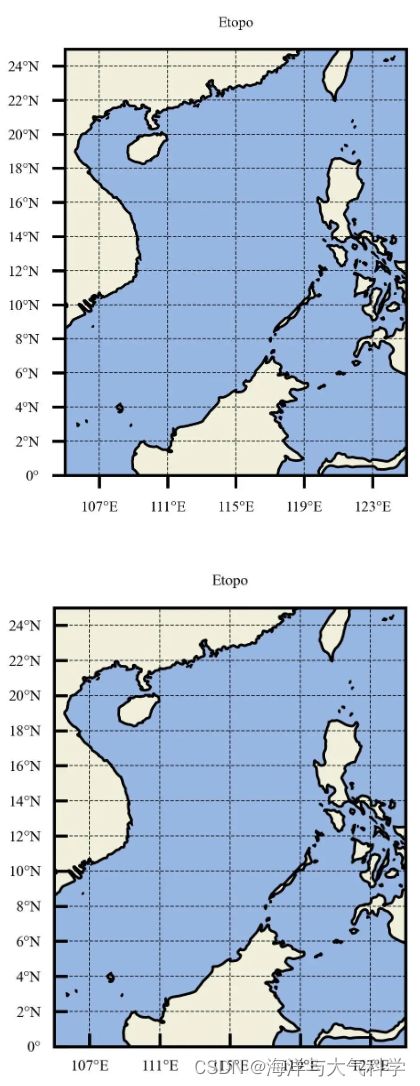
1:使用Cartopy画出范围图
导入函数包
import matplotlib.pyplot as plt
import cartopy.crs as ccrs
import cartopy.feature as feature
import numpy as np
import matplotlib.ticker as ticker
建立画布和设置投影
fig = plt.figure(dpi=300, figsize=(3, 2), facecolor=‘w’, edgecolor=‘blue’)#设置一个画板,将其返还给fig
proj = ccrs.PlateCarree(central_longitude=180)##
ax = fig.subplots(1, 1, subplot_kw={‘projection’: proj})
设置显示范围
ax.set_extent([105, 125, 0, 25], crs=ccrs.PlateCarree())
添加陆地、岸线和海洋
ax.add_feature(feature.COASTLINE.with_scale(‘50m’),lw=0.4)#添加海岸线
ax.add_feature(feature.LAND, edgecolor=‘black’)#边缘为黑色
ax.add_feature(feature.OCEAN)#添加海洋########
坐标轴网格绘制、显示刻度
gl = ax.gridlines(crs=ccrs.PlateCarree(), draw_labels=True,xlocs=np.arange(105, 125, 2),ylocs=np.arange(0, 25, 2),
linewidth=0.25, linestyle=‘–’, color=‘k’, alpha=0.8)#添加网格线,true
修改经纬度字体大小
gl.xlabel_style = {‘size’: 4, “color”: ‘k’, “font”: ‘Times New Roman’}
gl.ylabel_style = {‘size’: 4, ‘color’: ‘k’, “font”: ‘Times New Roman’}

隐藏右侧与上侧的刻度
gl.top_labels,gl.right_labels = False, False

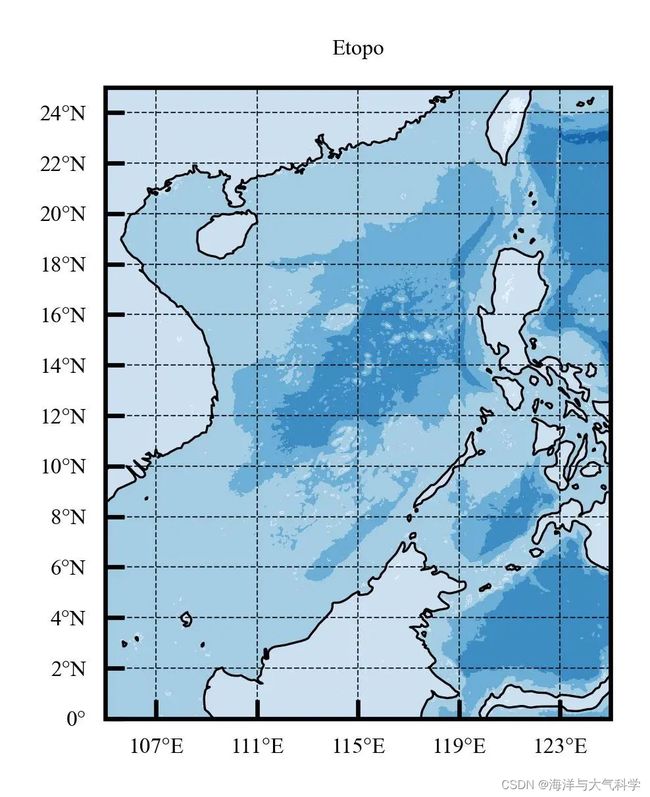
给坐标轴加tick
ax.set_xticks(np.arange(107, 125, 4), crs=ccrs.PlateCarree())#添加经纬度
ax.set_xticklabels(np.arange(107, 125, 4), fontsize=4)
ax.set_yticks(np.arange(0, 25, 2), crs=ccrs.PlateCarree())
ax.set_yticklabels(np.arange(0, 25, 2), fontsize=4)
ax.xaxis.set_major_formatter(LongitudeFormatter())
ax.yaxis.set_major_formatter(LatitudeFormatter())
ax.tick_params(color=‘k’, direction=‘in’)#更改刻度指向为朝内,颜色设置为蓝色

添加etopo水深数据
ax.contourf(lon, lat, ele[:, :], cmap=cmap_r, transform=ccrs.PlateCarree())

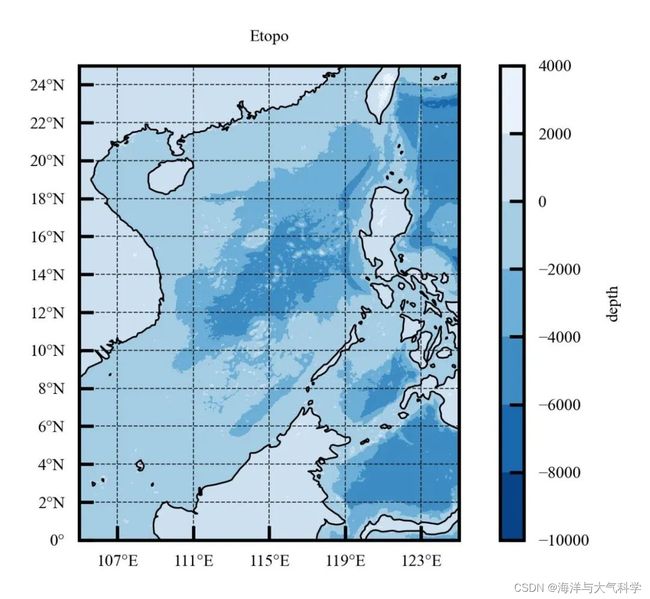
添加colorbar信息
------colorbar设置
cb=plt.colorbar(cf, ax=ax,extend=‘both’, orientation=‘vertical’)
cb.set_label(‘depth’,fontsize= 4,color=‘k’ )#设置colorbar的标签字体及其大小
cb.ax.tick_params(labelsize=4) #设置colorbar刻度字体大小。

colorbar的tick内置
cb.ax.tick_params(labelsize=4,direction=‘in’) #设置colorbar刻度字体大小。

测试数据:
通过百度网盘分享的文件:etopo
链接:https://pan.baidu.com/s/1K6i1nM955zX0H6WCQrH72g
提取码:hgnj
复制这段内容打开「百度网盘APP 即可获取」
参考文献及其在本文中的作用致谢!
1:Python气象绘图笔记(三)——地理图 - 知乎 (zhihu.com)
2:利用Cartopy绘制带有地图投影的图形 | ZSYXY Meteorological workshop (yxy-biubiubiu.github.io)
3:Python 空间绘图 - Cartopy 经纬度添加-腾讯云开发者社区-腾讯云 (tencent.com)
4:Python气象绘图教程(十三)—Cartopy_4-腾讯云开发者社区-腾讯云 (tencent.com)
5:python设置坐标轴刻度值字体大小,刻度值范围,标签大小-CSDN博客
6:cartopy绘图指南 - 知乎 (zhihu.com)
7:如何在 Matplotlib 中设置刻度标签 xticks 字体大小 | D栈 - Delft Stack
往期内容:
【python海洋专题一】查看数据nc文件的属性并输出属性到txt文件
【python海洋专题二】读取水深nc文件并水深地形图
【python海洋专题三】图像修饰之画布和坐标轴
Python海洋专题四之水深地图图像修饰
Python海洋专题五之水深地形图海岸填充
python海洋专题的测试数据
全文代码
# -*- coding: utf-8 -*-
# %%
# Importing related function packages
import matplotlib.pyplot as plt
import cartopy.crs as ccrs
import cartopy.feature as feature
import numpy as np
import matplotlib.ticker as ticker
from cartopy import mpl
from cartopy.mpl.ticker import LongitudeFormatter, LatitudeFormatter
from cartopy.mpl.gridliner import LONGITUDE_FORMATTER, LATITUDE_FORMATTER
from matplotlib.font_manager import FontProperties
from netCDF4 import Dataset
from palettable.cmocean.diverging import Delta_4
from palettable.colorbrewer.sequential import GnBu_9
from palettable.colorbrewer.sequential import Blues_9
from palettable.scientific.diverging import Roma_20
from pylab import *
def reverse_colourmap(cmap, name='my_cmap_r'):
    reverse = []
    k = []

    for key in cmap._segmentdata:
        k.append(key)
        channel = cmap._segmentdata[key]
        data = []

        for t in channel:
            data.append((1 - t[0], t[2], t[1]))
        reverse.append(sorted(data))

    LinearL = dict(zip(k, reverse))
    my_cmap_r = mpl.colors.LinearSegmentedColormap(name, LinearL)
    return my_cmap_r

cmap = Blues_9.mpl_colormap
cmap_r = reverse_colourmap(cmap)
cmap1 = GnBu_9.mpl_colormap
cmap_r1 = reverse_colourmap(cmap1)
cmap2 = Roma_20.mpl_colormap
cmap_r2 = reverse_colourmap(cmap2)
# 图一
# 设置地图全局属性
plt.rcParams['font.sans-serif'] = ['Times New Roman']  # 设置整体的字体为Times New Roman
fig = plt.figure(dpi=300, figsize=(3, 2), facecolor='w', edgecolor='blue')#设置一个画板,将其返还给fig
proj = ccrs.PlateCarree(central_longitude=180)##
ax = fig.subplots(1, 1, subplot_kw={'projection': proj})  # 创建子图
ax.set_extent([105, 125, 0, 25], crs=ccrs.PlateCarree()) # 设置显示范围
ax.add_feature(feature.COASTLINE.with_scale('50m'),lw=0.4)#添加海岸线:关键字lw设置线宽;linestyle设置线型
ax.add_feature(feature.LAND, edgecolor='black')#边缘为黑色
ax.add_feature(feature.OCEAN)######添加海洋########
gl = ax.gridlines(crs=ccrs.PlateCarree(), draw_labels=True,xlocs=np.arange(105, 125, 2),ylocs=np.arange(0, 25, 2),
        linewidth=0.25, linestyle='--', color='k', alpha=0.8)#添加网格线,true
#修改经纬度字体大小
gl.xlabel_style = {'size': 4, "color": 'k', "font": 'Times New Roman'}
gl.ylabel_style = {'size': 4, 'color': 'k', "font": 'Times New Roman'}
# 隐藏右侧与上侧的刻度
gl.top_labels, gl.right_labels = False, False
# ------tick向内
# plt.tick_params(direction='in')
plt.savefig('scs_elevation3.jpg', dpi=600, bbox_inches='tight', pad_inches=0.1)  # 输出地图,并设置边框空白紧密
plt.show()
# 在一个画板中添加子图,并设置投影方式。1,1,1分别代表行、列、在网格中子图位置。并将其返回给ax
# 图二
# 设置地图全局属性
plt.rcParams['font.sans-serif'] = ['Times New Roman']  # 设置整体的字体为Times New Roman
fig = plt.figure(dpi=300, figsize=(3, 2), facecolor='w', edgecolor='blue')#设置一个画板,将其返还给fig
# ax = plt.axes(projection=ccrs.PlateCarree(central_longitude=180))
ax = fig.add_axes([0.05, 0.08, 0.92, 0.8], projection=ccrs.PlateCarree(central_longitude=180))
#proj = ccrs.PlateCarree(central_longitude=180)##
#ax = fig.subplots(1, 1, subplot_kw={'projection': proj})  # 创建子图
ax.set_extent([105, 125, 0, 25], crs=ccrs.PlateCarree()) # 设置显示范围
ax.add_feature(feature.COASTLINE.with_scale('50m'),lw=0.4)#添加海岸线:关键字lw设置线宽;linestyle设置线型
ax.add_feature(feature.LAND, edgecolor='black')#边缘为黑色
ax.add_feature(feature.OCEAN)######添加海洋########
# 添加标题
ax.set_title('Etopo', fontsize=4)
# 利用Formatter格式化刻度标签
ax.set_xticks(np.arange(107, 125, 4), crs=ccrs.PlateCarree())#添加经纬度
ax.set_xticklabels(np.arange(107, 125, 4), fontsize=4)
ax.set_yticks(np.arange(0, 25, 2), crs=ccrs.PlateCarree())
ax.set_yticklabels(np.arange(0, 25, 2), fontsize=4)
ax.xaxis.set_major_formatter(LongitudeFormatter())
ax.yaxis.set_major_formatter(LatitudeFormatter())
ax.tick_params(color='k', direction='in')#更改刻度指向为朝内,颜色设置为蓝色
gl = ax.gridlines(crs=ccrs.PlateCarree(), draw_labels=False, xlocs=np.arange(107, 125, 4), ylocs=np.arange(0, 25, 2),
        linewidth=0.25, linestyle='--', color='k', alpha=0.8)#添加网格线
gl.top_labels,gl.bottom_labels,gl.right_labels,gl.left_labels = False,False,False,False

#修改经纬度字体大小
#gl.xlabel_style = {'size': 4, "color": 'k', "font": 'Times New Roman'}
#gl.ylabel_style = {'size': 4, 'color': 'k', "font": 'Times New Roman'}
plt.savefig('scs_elevation5.jpg', dpi=600, bbox_inches='tight', pad_inches=0.1)  # 输出地图,并设置边框空白紧密
plt.show()
# read data
# read data
a = Dataset('D:\pycharm_work\data\scs_etopo.nc')
print(a)
lon = a.variables['lon'][:]
lat = a.variables['lat'][:]
ele = a.variables['elevation'][:]
# plot
# 图三
# 设置地图全局属性
plt.rcParams['font.sans-serif'] = ['Times New Roman']  # 设置整体的字体为Times New Roman
fig = plt.figure(dpi=300, figsize=(3, 2), facecolor='w', edgecolor='blue')#设置一个画板,将其返还给fig
ax = fig.add_axes([0.05, 0.08, 0.92, 0.8], projection=ccrs.PlateCarree(central_longitude=180))
ax.set_extent([105, 125, 0, 25], crs=ccrs.PlateCarree()) # 设置显示范围
ax.add_feature(feature.COASTLINE.with_scale('50m'),lw=0.4)#添加海岸线:关键字lw设置线宽;linestyle设置线型
cf = ax.contourf(lon, lat, ele[:, :], cmap=cmap_r, transform=ccrs.PlateCarree())
# ------colorbar设置
cb=plt.colorbar(cf, ax=ax,extend='both', orientation='vertical')
cb.set_label('depth',fontsize= 4,color='k' )#设置colorbar的标签字体及其大小
cb.ax.tick_params(labelsize=4,direction='in') #设置colorbar刻度字体大小。
# 添加标题
ax.set_title('Etopo', fontsize=4)
# 利用Formatter格式化刻度标签
ax.set_xticks(np.arange(107, 125, 4), crs=ccrs.PlateCarree())#添加经纬度
ax.set_xticklabels(np.arange(107, 125, 4), fontsize=4)
ax.set_yticks(np.arange(0, 25, 2), crs=ccrs.PlateCarree())
ax.set_yticklabels(np.arange(0, 25, 2), fontsize=4)
ax.xaxis.set_major_formatter(LongitudeFormatter())
ax.yaxis.set_major_formatter(LatitudeFormatter())
ax.tick_params(color='k', direction='in')#更改刻度指向为朝内,颜色设置为蓝色
gl = ax.gridlines(crs=ccrs.PlateCarree(), draw_labels=False, xlocs=np.arange(107, 125, 4), ylocs=np.arange(0, 25, 2),
        linewidth=0.25, linestyle='--', color='k', alpha=0.8)#添加网格线
gl.top_labels,gl.bottom_labels,gl.right_labels,gl.left_labels = False,False,False,False
plt.savefig('scs_elevation8.jpg', dpi=600, bbox_inches='tight', pad_inches=0.1)  # 输出地图,并设置边框空白紧密
plt.show()
# 在一个画板中添加子图,并设置投影方式。1,1,1分别代表行、列、在网格中子图位置。并将其返回给ax
# 图三
# 设置地图全局属性
plt.rcParams['font.sans-serif'] = ['Times New Roman']  # 设置整体的字体为Times New Roman
fig = plt.figure(dpi=300, figsize=(3, 2), facecolor='w', edgecolor='blue')#设置一个画板,将其返还给fig
ax = fig.add_axes([0.05, 0.08, 0.92, 0.8], projection=ccrs.PlateCarree(central_longitude=180))
ax.set_extent([105, 125, 0, 25], crs=ccrs.PlateCarree()) # 设置显示范围
ax.add_feature(feature.COASTLINE.with_scale('50m'),lw=0.4)#添加海岸线:关键字lw设置线宽;linestyle设置线型
cf = ax.contourf(lon, lat, ele[:, :], cmap=cmap_r1, transform=ccrs.PlateCarree())
# ------colorbar设置
cb=plt.colorbar(cf, ax=ax,extend='both', orientation='vertical')
cb.set_label('depth',fontsize= 4,color='k' )#设置colorbar的标签字体及其大小
cb.ax.tick_params(labelsize=4,direction='in') #设置colorbar刻度字体大小。
# 添加标题
ax.set_title('Etopo', fontsize=4)
# 利用Formatter格式化刻度标签
ax.set_xticks(np.arange(107, 125, 4), crs=ccrs.PlateCarree())#添加经纬度
ax.set_xticklabels(np.arange(107, 125, 4), fontsize=4)
ax.set_yticks(np.arange(0, 25, 2), crs=ccrs.PlateCarree())
ax.set_yticklabels(np.arange(0, 25, 2), fontsize=4)
ax.xaxis.set_major_formatter(LongitudeFormatter())
ax.yaxis.set_major_formatter(LatitudeFormatter())
ax.tick_params(color='k', direction='in')#更改刻度指向为朝内,颜色设置为蓝色
gl = ax.gridlines(crs=ccrs.PlateCarree(), draw_labels=False, xlocs=np.arange(107, 125, 4), ylocs=np.arange(0, 25, 2),
        linewidth=0.25, linestyle='--', color='k', alpha=0.8)#添加网格线
gl.top_labels,gl.bottom_labels,gl.right_labels,gl.left_labels = False,False,False,False
plt.savefig('scs_elevation9.jpg', dpi=600, bbox_inches='tight', pad_inches=0.1)  # 输出地图,并设置边框空白紧密
plt.show()
# 在一个画板中添加子图,并设置投影方式。1,1,1分别代表行、列、在网格中子图位置。并将其返回给ax
# 图三
# 设置地图全局属性
plt.rcParams['font.sans-serif'] = ['Times New Roman']  # 设置整体的字体为Times New Roman
fig = plt.figure(dpi=300, figsize=(3, 2), facecolor='w', edgecolor='blue')#设置一个画板,将其返还给fig
ax = fig.add_axes([0.05, 0.08, 0.92, 0.8], projection=ccrs.PlateCarree(central_longitude=180))
ax.set_extent([105, 125, 0, 25], crs=ccrs.PlateCarree()) # 设置显示范围
ax.add_feature(feature.COASTLINE.with_scale('50m'),lw=0.4)#添加海岸线:关键字lw设置线宽;linestyle设置线型
cf = ax.contourf(lon, lat, ele[:, :], cmap=cmap_r2, transform=ccrs.PlateCarree())
# ------colorbar设置
cb=plt.colorbar(cf, ax=ax,extend='both', orientation='vertical')
cb.set_label('depth',fontsize= 4,color='k' )#设置colorbar的标签字体及其大小
cb.ax.tick_params(labelsize=4,direction='in') #设置colorbar刻度字体大小。
# 添加标题
ax.set_title('Etopo', fontsize=4)
# 利用Formatter格式化刻度标签
ax.set_xticks(np.arange(107, 125, 4), crs=ccrs.PlateCarree())#添加经纬度
ax.set_xticklabels(np.arange(107, 125, 4), fontsize=4)
ax.set_yticks(np.arange(0, 25, 2), crs=ccrs.PlateCarree())
ax.set_yticklabels(np.arange(0, 25, 2), fontsize=4)
ax.xaxis.set_major_formatter(LongitudeFormatter())
ax.yaxis.set_major_formatter(LatitudeFormatter())
ax.tick_params(color='k', direction='in')#更改刻度指向为朝内,颜色设置为蓝色
gl = ax.gridlines(crs=ccrs.PlateCarree(), draw_labels=False, xlocs=np.arange(107, 125, 4), ylocs=np.arange(0, 25, 2),
        linewidth=0.25, linestyle='--', color='k', alpha=0.8)#添加网格线
gl.top_labels,gl.bottom_labels,gl.right_labels,gl.left_labels = False,False,False,False
plt.savefig('scs_elevation10.jpg', dpi=600, bbox_inches='tight', pad_inches=0.1)  # 输出地图,并设置边框空白紧密
plt.show()

