Matplotlib/Seaborn-快速上手-3
Seaborn-Basis
- 概述
- 一、Matplotlib回顾
- 二、Seaborn 0.10.1简介
-
- 2.1 API
- 2.2 Relation Plots
- 2.3 使用OpenAI跑出来的数据举一个例子
- 三、总结
概述
Seaborn对Matplotlib进行了高度封装,可以快速可视化数据,调用起来就超级简单啦!下面会带大家熟悉一下基本的,Seaborn不用深入,想画什么图去Seaborn Example Gallary看看,具体参数是什么去Seaborn API看看,基本就okay了!但如果论文要弄漂亮的图的话,还是要掌握下Matplotlib的= =,后面举一个例子!
Seaborn API
Seaborn Tutorial
Seaborn Example Gallary
一、Matplotlib回顾
通过一个例子回顾一下Matplotlib,同时介绍两个偷懒的点:
- cycler 指定style、color、linewidth等属性
- plt.tight_layout():对当前figure内axes之间的layout进行调整
# cycler and tight_layout
from cycler import cycler
import numpy as np
import matplotlib.pyplot as plt

# 准备数据
x = np.linspace(0, 2 * np.pi, 50) # 范围[0,2pi]的50个datapoints
offsets = np.linspace(0, 2 * np.pi, 4, endpoint=False) # [0,2pi]中取4个偏移量
yy = np.transpose([np.sin(x + phi) for phi in offsets]) # [4,50]变成[50,4]

#设定每条线的style以及color
default_cycler = (cycler(color=['r', 'g', 'b', 'y']) +
                  cycler(linestyle=['-', '--', ':', '-.']))
custom_cycler = (cycler(color=['c', 'm', 'y', 'k']) +
                 cycler(lw=[1, 2, 3, 4]))

fig, (ax0, ax1) = plt.subplots(2,1) #一个figure,(2,1)布局的axes

# 对第一个axes操作
ax0.set_prop_cycle(default_cycler)
ax0.plot(yy)
ax0.set_title('Set default color cycle to rgby')

# 对第二个axes操作
ax1.set_prop_cycle(custom_cycler)
ax1.plot(yy)
ax1.set_title('Set axes color cycle to cmyk')

#fig.subplots_adjust(hspace=0.3) #手动调整axes之间的布局layout
#plt.tight_layout()  # 自动调整axes之间的布局layout
plt.show()
如果不用plt.tight_layout()的话,就会出现下面覆盖这种情况。
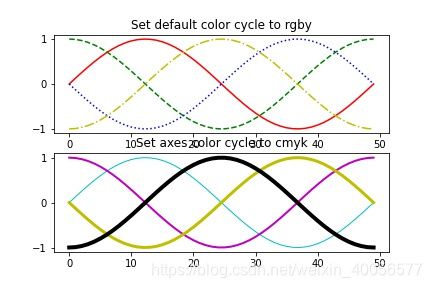
使用了plt.tight_layout()的话,就自动布局了,当然可以使用fig.subplots_adjust()进行手动布局,更灵活,但需要查参数啰~下面是自动布局的图:

当然有更细节的操作与布局,但暂时没需求呀,想深入的body可以参阅:Matplotlib官方Tutorial
补一个:
# 参数相对于fontsize
plt.tight_layout(pad=0.4, w_pad=0.5, h_pad=1.0)
二、Seaborn 0.10.1简介
使用的是seaborn 0.10.1的版本,可能会稍微与0.8.1有些出入。
2.1 API
- Relation plots
- Categorical plots
- Distribution plots
- Regression plots
- Matrix
- Multi-plot grids
- Color palettes
- Utility functions
输入的数据类型可以是numpy.array或者是pandas.DataFrame
主要以Relation Plots举例,seaborn想要plot啥看啥API~
Relation Tutorial在此:http://seaborn.pydata.org/tutorial/relational.html
2.2 Relation Plots
2.3 使用OpenAI跑出来的数据举一个例子
利用三个random seed跑了三个实验,每个实验记录了一个数据文件progress.txt,先读入数据:
import panda as pd
import matplotlib.pyplot as plt
import matplotlib as mlp
import seaborn as sns
import numpy as np

s0 = pd.read_table('/CarPole_s0/progress.txt')
s10 = pd.read_table('/CarPole_s10/progress.txt')
s20 = pd.read_table('/CarPole_s20/progress.txt')
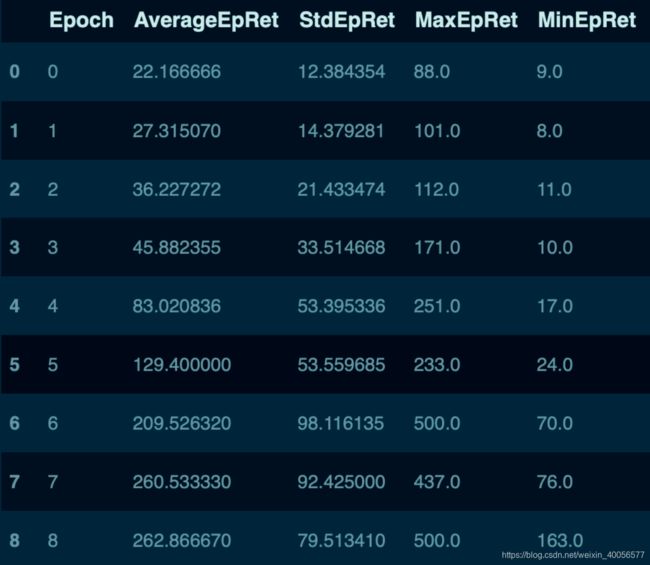
其中一个数据s0,有50个rows,21个colums:
print(s0.keys())
#output
Index(['Epoch', 'AverageEpRet', 'StdEpRet', 'MaxEpRet', 'MinEpRet', 'EpLen',
       'AverageVVals', 'StdVVals', 'MaxVVals', 'MinVVals',
       'TotalEnvInteracts','LossPi', 'LossV', 'DeltaLossPi',
'DeltaLossV','Entropy','KL','ClipFrac','StopIter','Time','legends'],dtype='object')
如果直接调用:
# 设置style之类的
sns.set(style="darkgrid", font_scale=1.2)
mlp.rc('lines', linewidth=4)

# 创建图、标题
fig = plt.figure()
plt.title('Three Comparisions')

datasets = [s0,s10,s20]
for i in range(3):
    ax = sns.lineplot(x="Epoch", y="AverageEpRet",data=datasets[i])
	# 此处直接调用lineplot
plt.tight_layout() #无脑tight_layout()
plt.show()
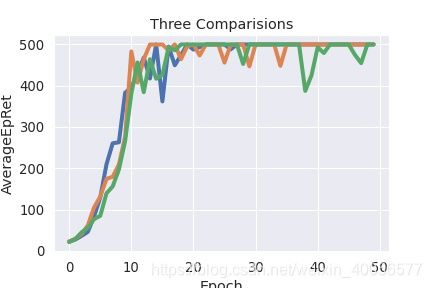
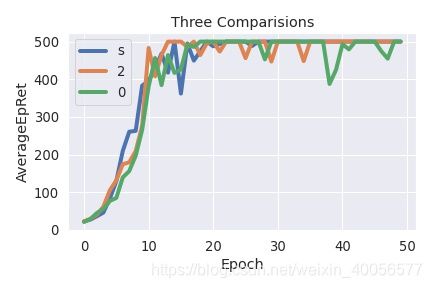
然后发现没有legend,但因为是调用lineplot的问题,lineplot内部已经有了legend,如果要对应实验一个legend会有问题(这也是调了一个高级API的坏处),怎么处理好呢?(会的高手提醒一下)
sns.set(style="darkgrid", font_scale=1.2)
mlp.rc('lines', linewidth=4)

legends = ['s0','s10','s20']
datasets = [s0,s10,s20]

fig = plt.figure()
plt.title('Three Comparisions')

for i in range(3):
    sns.lineplot(x="Epoch", y="AverageEpRet",data=datasets[i])
    plt.legend(legends[i])

plt.tight_layout()
plt.show()
下面是我想的办法:
sns.set(style="darkgrid", font_scale=1.2)
mlp.rc('lines', linewidth=4)

datasets = [s0,s10,s20]
legends = ['s0','s10','s20']

## 对每个dataset多插入一列legends,视为legend的label
for i in range(3):
    datasets[i].insert(len(datasets[i].columns),'legends',legends[i])

s = pd.concat([s0,s10,s20],ignore_index = True)


fig = plt.figure(1)
plt.title('Three Comparisions')

###调用时将hue(颜色)指定为legends那一列,lineplot会对其自动分类,并生成legend
ax = sns.lineplot(x="Epoch", y="AverageEpRet",data=s, hue='legends')

plt.show()
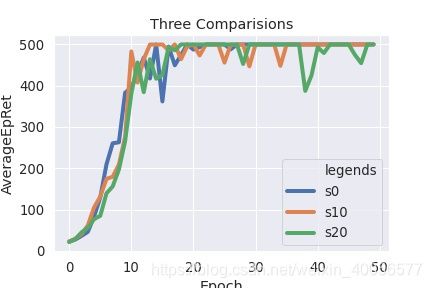
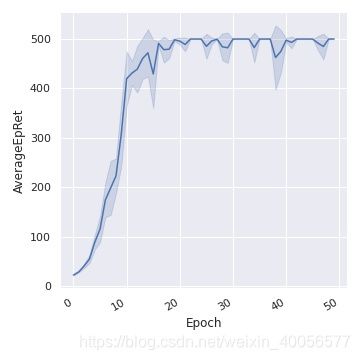
最后lineplot里实际上是拥有对同一个x,多个y情况下处理的能力,即将三个random seed的实验图变为:
# ci = ‘confidence interval’, sd = 'standard deviation'
ax = sns.lineplot(x="Epoch", y="AverageEpRet",data=s, ci='sd')
三、总结
- Matplotlib中两个cycler以及tight_layout()的小操作
- Seaborn主要是看API并且调用,然后是一个应用的例子
- 出现了一个小问题,通过给dataset设置新的列解决了。
25个常用Matplotlib图的Python代码,收藏收藏
Matplotlib API


