matplotlib教程——matplotlib与tkinter的集成
一、matplotlib与tkinter集成
我们在使用tkinter编写窗体程序的时候,希望做一些可视化的处理,即将matplotlib所化的图像与tkinter集成在一起显示,
二、实现代码
import math
import numpy as np
#-------------------------------------------------------------------------------------------
import matplotlib
import matplotlib.pyplot as plt
from matplotlib.pylab import mpl
from matplotlib.backends.backend_tkagg import FigureCanvasTkAgg,NavigationToolbar2Tk #NavigationToolbar2TkAgg
#------------------------------------------------------------------------------------------
import tkinter as tk
#------------------------------------------------------------------------------------------


mpl.rcParams['font.sans-serif'] = ['SimHei']  #中文显示
mpl.rcParams['axes.unicode_minus']=False      #负号显示

class From:
    def __init__(self):
        self.root=tk.Tk()                    #创建主窗体
        self.canvas=tk.Canvas()              #创建一块显示图形的画布
        self.figure=self.create_matplotlib() #返回matplotlib所画图形的figure对象
        self.create_form(self.figure)        #将figure显示在tkinter窗体上面
        self.root.mainloop()

    def create_matplotlib(self):
        #创建绘图对象f
        f=plt.figure(num=2,figsize=(16,12),dpi=80,facecolor="pink",edgecolor='green',frameon=True)
        #创建一副子图
        fig1=plt.subplot(1,1,1)

        x=np.arange(0,2*np.pi,0.1)
        y1=np.sin(x)
        y2=np.cos(x)

        line1,=fig1.plot(x,y1,color='red',linewidth=3,linestyle='--')    #画第一条线
        line2,=fig1.plot(x,y2)
        plt.setp(line2,color='black',linewidth=8,linestyle='-',alpha=0.3)#华第二条线

        fig1.set_title("这是第一幅图",loc='center',pad=20,fontsize='xx-large',color='red')    #设置标题
        line1.set_label("正弦曲线")                                                           #确定图例
        fig1.legend(['正弦','余弦'],loc='upper left',facecolor='green',frameon=True,shadow=True,framealpha=0.5,fontsize='xx-large')

        fig1.set_xlabel('横坐标')                                                             #确定坐标轴标题
        fig1.set_ylabel("纵坐标")
        fig1.set_yticks([-1,-1/2,0,1/2,1])                                                   #设置坐标轴刻度
        fig1.grid(which='major',axis='x',color='r', linestyle='-', linewidth=2)              #设置网格

        return f

    def create_form(self,figure):
        #把绘制的图形显示到tkinter窗口上
        self.canvas=FigureCanvasTkAgg(figure,self.root)
        self.canvas.draw()  #以前的版本使用show()方法,matplotlib 2.2之后不再推荐show()用draw代替,但是用show不会报错,会显示警告
        self.canvas.get_tk_widget().pack(side=tk.TOP, fill=tk.BOTH, expand=1)

        #把matplotlib绘制图形的导航工具栏显示到tkinter窗口上
        toolbar =NavigationToolbar2Tk(self.canvas, self.root) #matplotlib 2.2版本之后推荐使用NavigationToolbar2Tk,若使用NavigationToolbar2TkAgg会警告
        toolbar.update()
        self.canvas._tkcanvas.pack(side=tk.TOP, fill=tk.BOTH, expand=1)

if __name__=="__main__":
    form=From()
三、总结
matplotlib与tkinter集成主要是通过两个类完成的,如下
(1)将图像显示在tkinter里面——三步走
#把绘制的图形显示到tkinter窗口上
self.canvas=FigureCanvasTkAgg(figure,self.root) #当然这里不一定显示在root,可以使frame,tabcontrol等等
self.canvas.draw()
#以前的版本使用show()方法,matplotlib 2.2之后不再推荐show()用draw代替,但是用show不会报错,会显示警告
self.canvas.get_tk_widget().pack(side=tk.TOP, fill=tk.BOTH, expand=1)
(2)将图像的相关工具也显示出来——三步走
#把matplotlib绘制图形的导航工具栏显示到tkinter窗口上
toolbar =NavigationToolbar2Tk(self.canvas, self.root) #matplotlib 2.2版本之后推荐使用NavigationToolbar2Tk,若使用 NavigationToolbar2TkAgg会警告
toolbar.update()
self.canvas._tkcanvas.pack(side=tk.TOP, fill=tk.BOTH, expand=1)
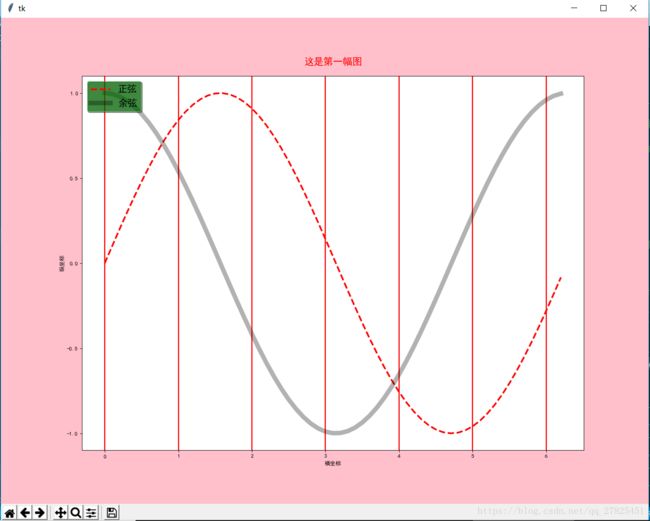
四、实现效果
