Vue3使用ECharts数据可视化控件
Vue3使用ECharts数据可视化控件
1:安装并引入ECharts
1.1:安装echarts
新建终端输入一下命令
yarn add echarts vue-echarts
yarn add -D @vue/composition-api
2:在页面中使用Echars组件
2:ECharts配置项
2.1:title配置
title 标题组件,包含主标题和副标题。
更多的详情设置可以见官网
Documentation - Apache ECharts
		title:{
            text:"helloworld",
            // 设置主标题点击之后的超链接
            link:"https://echarts.apache.org/zh/option.html#title",
            // 设置打开超链接的方式,self就是当前页打开超链接
            target:"self",
            // 设置背景颜色
            backgroundColor:"pink",
            // 设置边框颜色
            borderColor:"red",
            // 设置边框粗细
            borderWidth:5,
            // 设置标题居中
            x:"center",
            // 设置主标题文字样式
            textStyle:{
              color:"yellow",
              fontSize:30
            },
            // 设置副标题
            subtext:"副标题",
            // 设置副标题的超链接
            sublink:"https://echarts.apache.org/zh/index.html",
            // 设置副标题文字样式
            subtextStyle:{
              color:"yellow",
              fontSize:15
            },
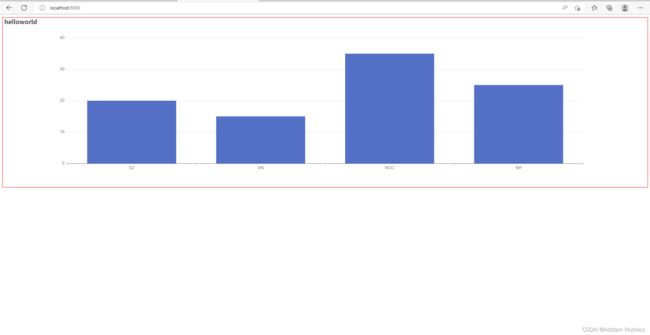
标题效果如下:
更多设置:
      title: {
        show: true, //显示策略,默认值true,可选为:true(显示) | false(隐藏)
        text: "1主标题", //主标题文本,'\n'指定换行
        // link:'http://www.baidu.com', //主标题文本超链接,默认值true
        // target: "self", //指定窗口打开主标题超链接,支持'self' | 'blank',不指定等同为'blank'(新窗口)
        subtext: '副标题', //副标题文本,'\n'指定换行
        // sublink: '', //副标题文本超链接
        // subtarget: null, //指定窗口打开副标题超链接,支持'self' | 'blank',不指定等同为'blank'(新窗口)
        // x:'center', //水平安放位置,默认为'left',可选为:'center' | 'left' | 'right' | {number}(x坐标,单位px)
        // y: 'bottom', //垂直安放位置,默认为top,可选为:'top' | 'bottom' | 'center' | {number}(y坐标,单位px)
        // backgroundColor: 'red', //标题背景颜色,默认'rgba(0,0,0,0)'透明
        // borderWidth: 5, //标题边框线宽,单位px,默认为0(无边框)
        // borderColor: '#ccffee', //标题边框颜色,默认'#ccc'
        // padding: 5, //标题内边距,单位px,默认各方向内边距为5,接受数组分别设定上右下左边距
        // itemGap: 10, //主副标题纵向间隔,单位px,默认为10
        // textStyle: { //主标题文本样式{"fontSize": 18,"fontWeight": "bolder","color": "#333"}
            // fontFamily: 'Arial, Verdana, sans...',
            // fontSize: 12,
            // fontStyle: 'normal',
            // fontWeight: 'normal', // },
            // subtextStyle: {//副标题文本样式{"color": "#aaa"}
            // fontFamily: 'Arial, Verdana, sans...',
            // fontSize: 12,
            // fontStyle: 'normal',
            // fontWeight: 'normal',
          // },
          // subtextStyle: {
          //   color: "#a1b2c3", // 副标题文字的颜色。
          //   fontStyle: "normal", // 副标题文字字体的风格。 'normal'  'italic'  'oblique'
          //   fontWeight: "bold", // 副标题文字字体的粗细。 'normal' 'bold'  'bolder'  'lighter' 500|600。
          //   fontSize: 18, // 字体大小
          //   lineHeight: "130", // 行高
          //   textBorderColor: "red", // 文字本身的描边颜色。
          //   textBorderWidth: 5, // 文字本身的描边宽度。
          //   textShadowColor: "transparent", // 文字本身的阴影颜色。
          //   textShadowBlur: 0, // 文字本身的阴影长度。
          //   textShadowOffsetX: 0, // 文字本身的阴影 X 偏移。
          //   textShadowOffsetY: 0, //  文字本身的阴影 Y 偏移。
          // },
      },
2.2:提示框组件(tooltip)
用于配置鼠标滑过或点击图表时的显示框
Documentation - Apache ECharts
现在不作任何处理,就在xAxis和yAxis同级的地方只加一个tooltip:{},效果如下
tooltip:{
            // 触发类型
            // trigger:"item",      // 图形触发,就是鼠标移动在柱状图形以内的区域触发
            trigger:"axis",          // 坐标轴触发,只要在坐标轴的范围内就触发器,哪怕在柱状图形上面
            // 坐标轴指示器
            axisPointer:{
              type:"cross"   // line:显示一个实线  shadow:阴影效果   cross:十字准星效果
            },
            // 是否显示出页面的悬浮弹框
            showContent:true,
            // 悬浮层样式
            backgroundColor:"pink",
            borderColor:"red",
            borderWidth:5,
            // 设置文字样式
            textStyle:{
              color:"yellow"
            }
          },
效果如下:
当然,我们也可以设置提示框的提示信息,通过formatter。
Documentation - Apache ECharts
修改一下date:
            data:[
              {"value":20, "nikename":"伊泽瑞尔"},
              {"value":15, "nikename":"薇恩"},
              {"value":24, "nikename":"梦魇"},
              {"value":10, "nikename":"好运姐"},
            ]
tooltip里面设置如下:
            // 自定义提示框信息
            formatter(params){
              // 可以控制台打印一下这个信息
              // console.log(params)
              for(var i=0;i<params.length;i++){
                return "名字:"+params[i].name + "--中文名:"+params[i].data.nikename+"--使用人数:"+params[i].data.value
              }
            }
结果如下:
更多设置
      tooltip: {//提示框组件,用于配置鼠标滑过或点击图表时的显示框。
        show: true, // 是否显示
        trigger: 'axis', // 触发类型  'item'图形触发:散点图,饼图等无类目轴的图表中使用; 'axis'坐标轴触发;'none':什么都不触发。
        axisPointer: { // 坐标轴指示器配置项。
            type: 'cross', // 'line' 直线指示器  'shadow' 阴影指示器  'none' 无指示器  'cross' 十字准星指示器。
          },
        // showContent: true, //是否显示提示框浮层,默认显示。
        // triggerOn: 'mouseover', // 触发时机'click'鼠标点击时触发。
        backgroundColor: 'rgba(50,50,50,0.7)', // 提示框浮层的背景颜色。
        borderColor: '#333', // 提示框浮层的边框颜色。
        borderWidth: 0, // 提示框浮层的边框宽。
        padding: 5, // 提示框浮层内边距,
        textStyle: { // 提示框浮层的文本样式。
            color: '#fff',
            fontStyle: 'normal',
            fontWeight: 'normal',
            fontFamily: 'sans-serif',
            fontSize: 14,
        },
        // 提示框浮层内容格式器,支持字符串模板和回调函数两种形式。
        // 模板变量有 {a}, {b},{c},分别表示系列名,数据名,数据值等
        // formatter: '{a}--{b} 的成绩是 {c}'
        formatter: function(arg) {
            return arg[0].name + '的分数是:' + arg[0].data
        }
      },
2.3:图例组件——legend
图例组件展现了不同系列的标记,颜色和名字。可以通过点击图例控制哪些系列不显示。
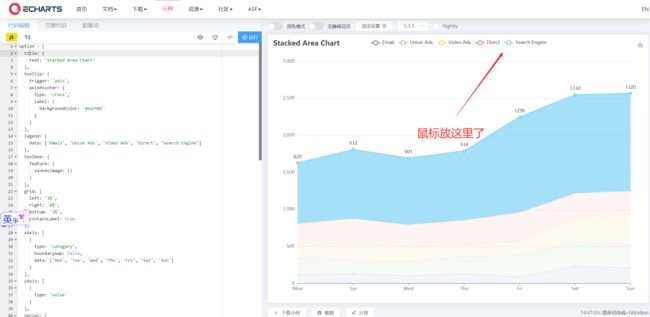
这个图例具体作用可见这个Examples - Apache ECharts
现在添加了如下代码
		legend:{
            show:true,    // 设置图例的开启或者是关闭
          },
效果见下图:
点击一下添加的图例,柱状图就会被隐藏
          legend:{
            show:true,    // 设置图例的开启或者是关闭
            // icon:"circle",    // 设置图例样式,circle代表是圆形
            // 设置图例位置
            top:"10%",
            left:"10%",
            // 设置图例宽高
            itemWidth:10,
            itemHeight:20,
            // 设置文字信息
            textStyle:{
              color:"red",
              fontSize:30,
              backgroundColor:"pink"
            }
          },
结果如下:
更多设置:
      legend: {
        show: true, //是否显示
        icon: "circle",//图例样式
        // top: "55%", // 组件离容器的距离
        // bottom:"20%", // 组件离容器的距离
        // left 的值可以是像 20 这样的具体像素值,可以是像 '20%' 这样相对于容器高宽的百分比,也可以是 'left', 'center', 'right'
        // right: "5%",
        // left:"10%" // // 组件离容器的距离
        // padding: 5, // 图例内边距
        // itemWidth: 6, // 图例标记的图形宽度。
        // itemGap: 20, // 图例每项之间的间隔。
        // itemHeight: 14, // 图例标记的图形高度。
        // selectedMode: false, // 图例选择的模式,控制是否可以通过点击图例改变系列的显示状态。默认开启图例选择,可以设成 false 关闭。
        inactiveColor: "#fffddd", // 图例关闭时的颜色。
        textStyle: {//图例的公用文本样式。
          // color: "#aabbcc", // 文字的颜色。
          // fontStyle: "normal", // 文字字体的风格。'italic'
          // fontWeight: "normal", // 文字字体的粗细。 'normal' 'bold' 'bolder' 'lighter' 100 | 200 | 300 | 400...
          // fontFamily: "sans-serif", // 文字的字体系列。
          // fontSize: 12, // 文字的字体大小。
          // lineHeight: 20, // 行高。
          // backgroundColor: "transparent", // 文字块背景色。
          // borderColor: "transparent", // 文字块边框颜色。
          // borderWidth: 0, // 文字块边框宽度。
          // borderRadius: 0, // 文字块的圆角。
          // padding: 0, // 文字块的内边距
          // shadowColor: "transparent", // 文字块的背景阴影颜色
          // shadowBlur: 0, // 文字块的背景阴影长度。
          // shadowOffsetX: 0, // 文字块的背景阴影 X 偏移。
          // shadowOffsetY: 0, // 文字块的背景阴影 Y 偏移。
          // // width: 50, // 文字块的宽度。 默认
          // // height: 40, // 文字块的高度 默认
          // textBorderColor: "transparent", // 文字本身的描边颜色。
          // textBorderWidth: 0, // 文字本身的描边宽度。
          // textShadowColor: "transparent", // 文字本身的阴影颜色。
          // textShadowBlur: 0, // 文字本身的阴影长度。
          // textShadowOffsetX: 0, // 文字本身的阴影 X 偏移。
          // textShadowOffsetY: 0, // 文字本身的阴影 Y 偏移。
        }
      },
3:ECharts绘制基本图形
3.1:ECharts绘制柱状图
3.1.1:基本柱状图的设置
3.1.2:柱状图的更多效果
设置最大值最小值的标记
这个需要在service中进行设置
            // 设置最大值和最小值的展示
            markPoint:{
              data:[//标注的数据数组,每一项都是一个对象
                {
                  type:"max",
                  name:"最大值"
                },{
                  type:"min",
                  name:"最小值"
                }
              ]
            }
设置显示平均值
		// 图标的标线
            markLine:{
              data:[
                {
                  type:"average",
                  name: "平均值"
                }
              ]
            }
3.1.3:水平柱状图
		xAxis:{   // 配置x轴参数
            data:xDate,
            type:"category"   // 坐标轴类型  value是数据轴   category是类目轴
          },
          yAxis:{   // 配置y轴参数
          },
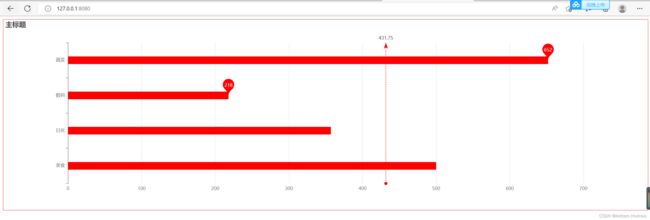
之前设置x轴为类目轴,则y轴就位数据轴,我们如果想做水平的柱状图把xAxis和yAxis配置交换即可
          xAxis:{   // 配置x轴参数
            type:"value"   // 坐标轴类型  value是数据轴   category是类目轴
          },
          yAxis:{   // 配置y轴参数
            data:xDate,
            type:"category"   // 坐标轴类型  value是数据轴   category是类目轴
          },
如果要设置轴的样式就需要在series里面做手脚了
            barWidth:20,            // 设置轴宽度
            color:"red",            // 设置轴颜色
也可以单独设置每一个轴的颜色或者样式,但是我相信没有项目会这么无聊,就不写了
3.2:ECharts绘制饼状图
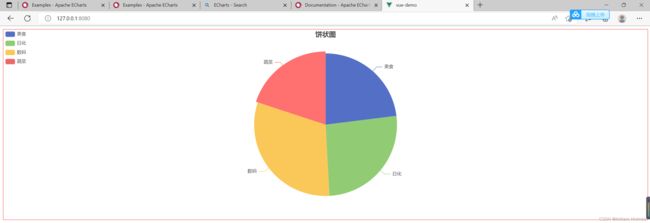
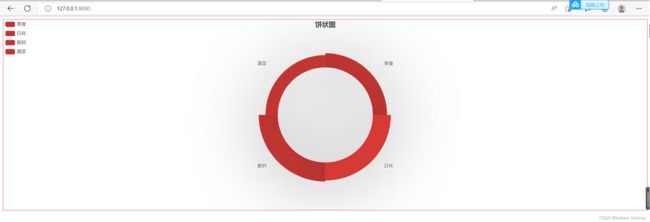
3.2.1:绘制一个最基本的饼状图
3.2.2:饼状图的更多设置
修改系列项
	// 系列
      series:{
        name:"销量统计",
        // 设置图表类型, pie就是饼状图
        type:"pie",
        data: data,
        radius:["50%", "70%"],  // 设置饼图半径,第一项为内半径,第二项为外半径
        // 设置环形图的文本标签
        label:{
          show:true,
          position:"outsize"   // outsize外侧展示,inside:内展示(在饼状图颜色区域内),center:中心展示(饼状图中心)
        },
        // 是否设置成南丁格尔图
        roseType:"area",
        itemStyle:{ // 设置显示样式
          color:"#c23531",  // 设置饼状图颜色
          shadowBlur:200,   // 设置阴影
          shadowColor: 'rgba(0, 0, 0, 0.5)'// 设置阴影颜色
        }
      }
3.3:ECharts绘制折线图
3.3.1:折线图的基本设置
<template>
  <!--  ECharts默认宽高是0,如果不设置页面是不显示的-->
  <div ref="mychart" id="demoDIV" ></div>
</template>

<script>
// 1:引用echarts
import * as echarts from 'echarts'
export default {
  mounted(){
    // 1. 初始化
    let myEcharts = echarts.init(this.$refs.mychart);
    // 2.设置数据
    let xData = ['Mon', 'Tue', 'Wed', 'Thu', 'Fri', 'Sat', 'Sun']
    let data = [150, 230, 224, 218, 135, 147, 260]
    // 3.设置配置项
    let option={
      title:{
        text:"折线图",
      },
      xAxis:{
        type:"category",
        data:xData
      },
      yAxis:{
        type:"value"
      },
      // 设置系列
      series:[
        {
          data:data,
          type:"line"   //line代表折线图
        }
      ]

    }
    // 4:设置配置项
    myEcharts.setOption(option);
  }
}
</script>

<style>
#demoDIV{
  width: 100%;
  height: 500px;
  border: 1px solid red;
}
</style>
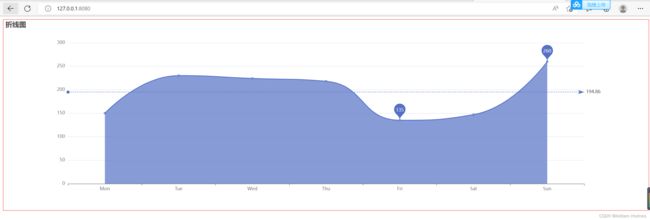
基本折线图效果如下:
3.3.2:折线图的更多设置
如果想对折线图进行过多设置就应该在series中进行设置
      // 设置系列
      series:[
        {
          data:data,
          type:"line",   //line代表折线图
          smooth:true,    //开启平滑样式
          areaStyle:{},     //开启样式填充
          markPoint:{
            data:[
              {type:"max", name:"最大值"},
              {type:"min", name:"最小值"}
            ]
          },
          markLine:{
            data:[
              {type:"average", name:"平均值"}
            ]
          }
        }
      ]
3.3.3:设置折线堆叠效果
3.4:ECharts绘制散点图
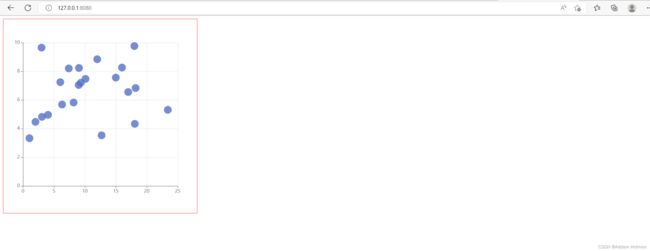
3.4.1:散点图的基本设置
3.4.1:散点图的更多设置
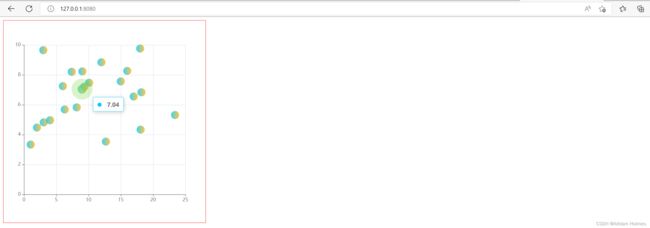
设置颜色效果(渐变色)
		// 添加图像的样式
          color:{
            // 线性渐变
            type: "linear",
            // 相当于在图形包围盒中的百分比
            x:0,
            y:0,
            x2:1,
            y2:0,
            colorStops:[
                {
                  offset:0,
                  color:"#00ccff"
                },{
                  offset:1,
                  color:"rgba(255,173,2,.9)"
                }
            ]
          }
设置鼠标移上去颜色高亮
		emphasis: {//高亮的图形和标签样式
            itemStyle: {
              borderColor: "rgba(102,205,46,0.30)",
              borderWidth: 30,
            },
          },
也可以添加一个鼠标移入的提示框组件
tooltip: {},//提示框组件
效果如下:
3.5:配置项–grid
grid 为直角坐标系内绘图网格。可以在网格上绘制折线图,柱状图 散点图(气泡图)也就是设置图标离容器的距离样式。
grid配置项:图标离容器的距离
-
how:是否显示直角坐标系网格-----------值:true?false
-
left:图表离容器左侧的距离-----------------值:number?百分比
-
top:图表离容器顶部的距离-----------------值:number?百分比
-
right:图表离容器右侧的距离---------------值:number?百分比
-
bottom:图表离容器底部的距离------------值:number?百分比
-
backgroundColor:网格背景色-------------值:rgba或#000000
-
borderColor:网格的边框颜色--------------值:rgba或#000000
-
borderWidth:网格的边框线宽-------------值:number
3.6:ECharts绘制K线图
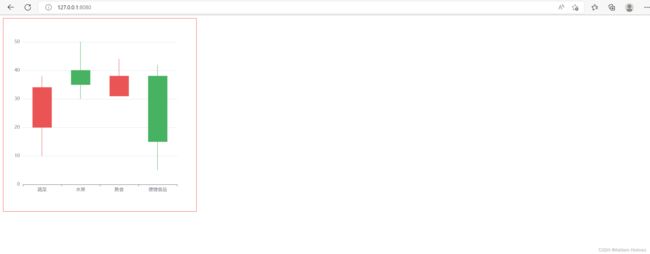
3.6.1:基本的K线图设置
效果如下:
3.6.2:K线图样式优化
设置鼠标移入之后的提示信息:
	tooltip: {
        //设置提示框
        trigger: "axis",
        axisPointer: {
          type: "cross",
        },
      },
设置样式颜色:
在Series里面添加设置
		// 设置颜色
          itemStyle: {
            color: "#ec0000", //上涨的颜色
            color0: "pink", //下跌的颜色
            borderColor: "#8A0000", //上涨的边框色
            borderColor0: "#008F28", //下跌的边框色
          },
添加提示框信息
		markPoint:{
            data:[
              {
                name: "最大值",
                type: "max",
                valueDim: "highest", //valueDim 指定是在哪个维度上的最大值、最小值、平均值
              },
              {
                name: "最小值",
                type: "min",
                valueDim: "lowest",
              },
              {
                name: "平均值",
                type: "average",
                valueDim: "close",
              },
            ]
          }
yle>
效果如下:

[外链图片转存中...(img-sIDMz05W-1661389243080)]

#### 3.6.2:K线图样式优化

设置鼠标移入之后的提示信息:

```javascript
	tooltip: {
        //设置提示框
        trigger: "axis",
        axisPointer: {
          type: "cross",
        },
      },
设置样式颜色:
在Series里面添加设置
		// 设置颜色
          itemStyle: {
            color: "#ec0000", //上涨的颜色
            color0: "pink", //下跌的颜色
            borderColor: "#8A0000", //上涨的边框色
            borderColor0: "#008F28", //下跌的边框色
          },
添加提示框信息
		markPoint:{
            data:[
              {
                name: "最大值",
                type: "max",
                valueDim: "highest", //valueDim 指定是在哪个维度上的最大值、最小值、平均值
              },
              {
                name: "最小值",
                type: "min",
                valueDim: "lowest",
              },
              {
                name: "平均值",
                type: "average",
                valueDim: "close",
              },
            ]
          }
