课程设计:基于Python的爬虫租房数据分析
1.课程设计
1.1.设计目的:
通过项目设计,全面掌握数据采集和预处理的原理和应用范围,掌握数据采集的过程,完成数据清洗,存储和展示,熟悉运用数据采集和预处理的相关工具
1.2.开发背景:
现实情况的背景下,人们意识到如何有效地解决海量数据的利用问题具有研究价值和经济利益。但是面对如此海量的数据并且维度高、数据结构复杂,如何能够有效的从中挖掘出数据价值并进行分析是人们需要面对的问题
2.总体设计
2.1.系统描述:
利用Jupyter工具通过python爬虫技术获取网站数万条北京租房数据,分析真实的房租状况,数据获取爬好的数据存放.csv文件中并通过数据清洗预览、数据分析可视化来探究
2.2.本实验使用的python第三方库
名称 版本 简介
Statsmodels 0.12.0 统计模型
Numpy 1.15.1 线性代数
Pandas 0.24.2 数据分析
Requests 2.20.0 爬虫网络请求
Seaborn 0.9.0 数据可视化
Matplotlib 3.0.3 数据可视化
Bs4 0.0.1 HTML解析
2.3.功能概述
(1)通过安装并引用第三方库,获取网页信息
(2)对文件数据进行简单的数据清洗与保存
(3)读取爬出的信息并对数据进行数字化和可视化
3.基本运行流程图

4.代码实现
4.1.数据采集部分
import numpy as np
import pandas as pd
import requests
import time
import re
import seaborn as sns
import statsmodels.api as sm
import statsmodels.formula.api as smf
import matplotlib.pyplot as plt
from bs4 import BeautifulSoup
# 步骤2 数据爬取:获取一个区域的租房链接地址
headers = {
'User-Agent': 'Mozilla/5.0 (X11; Linux x86_64) AppleWebKit/537.36 \
(KHTML, like Gecko) Chrome/63.0.3239.108 Safari/537.36'}
def get_areas(url):
try:
print('start grabing areas')
resposne = requests.get(url, headers=headers, timeout=30)
html = resposne.content
soup = BeautifulSoup(html, 'html.parser')
all_sights = soup.findAll('li', 'filter__item--level2')
areas = []
areas_links = []
for item in all_sights:
if not item.get_text()=='\n不限\n':
areas.append(item.get_text())
areas_links.append('https://bj.lianjia.com'+item.find('a').get('href'))
return areas, areas_links
except Exception as e:
print('爬取网站出现了一点问题,问题如下:')
print(e)
return ''
# 步骤3 数据爬取:获取该区域下的租房信息链接
def get_pages(area, area_link):
    print("开始抓取页面")
    resposne = requests.get(area_link, headers=headers)
    html = resposne.content
    soup = BeautifulSoup(html, 'html.parser')
    pages = int(soup.findAll('div', 'content__pg')[0].get('data-totalpage'))

    print("这个区域有" + str(pages) + "页")
    info = []
    for page in range(1,pages+1):
        url = 'https://bj.lianjia.com/zufang/dongcheng/pg' + str(page)
        print("\r开始抓取%s页的信息, 已爬取%s条数据"%(str(page), len(info)), end='')
        info += get_house_info(area, url)
    return info
# 步骤4 数据爬取:解析租房房产信息
def get_house_info(area, url, info=[]):
# time.sleep(2)
try:
resposne = requests.get(url, headers=headers)
html = resposne.content
soup = BeautifulSoup(html, 'html.parser')
all_text = soup.findAll('div', 'content__list--item')
for item in all_text:
item = item.get_text()
item = item.replace(' ', '').split('\n')
while "" in item:
item.remove("")
while "/" in item:
item.remove("/")
info.append(item)
return info
except Exception as e:
print(e)
time.sleep(2)
return get_house_info(area, url)# 步骤5 数据爬取:开始爬虫任务
info = []
url = 'https://bj.lianjia.com/zufang'
areas, area_link = get_areas(url)
info = get_pages(areas[1], area_link[1])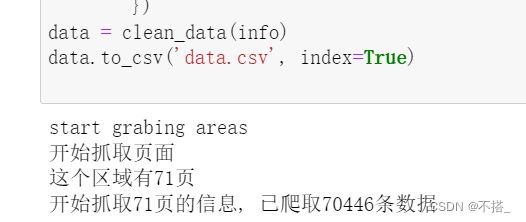
# 步骤6 数据爬取:简单数据清洗与保存数据
def keys(info, key=''):
    ls = []
    for item in info:
        if key in item:
            ls.append(key)
        else:
            ls.append('')
    return ls

def clean_data(info, key=''):
    title = [item[0] for item in info]
    address = [item[1] for item in info]
    area = [item[2] for item in info]
    toward = [item[3] for item in info]
    style = [item[4] for item in info]
    floor = [item[5] for item in info]

    source = [item[6] for item in info]
    time = [item[7] for item in info]
    price = [item[-1] for item in info]

    subway = keys(info, '近地铁')
    decorate = keys(info, '精装')
    heating = keys(info, '集中供暖')
    new_room = keys(info, '新上')
    time_for_look = keys(info, '随时看房')
    return pd.DataFrame({
        'title': title,
        'address': address,
        'area': area,
        'toward': toward,
        'style': style,
        'floor': floor,
        'source': source,
        'time': time,
        'price': price,
        'subway': subway,
        'decorate': decorate,
        'heating': heating,
        'new_room': new_room,
        'time_for_look': time_for_look
        })
data = clean_data(info)
data.to_csv('data.csv', index=True)
#读取已爬取的数据,并对数据进行数字化
data = pd.read_csv('./data.csv')
# 客厅数量
data['sitting_room_value'] = data['style'].apply(lambda x: x.split('厅')[0][-1])
data['sitting_room_value'] = data['sitting_room_value'].replace('卫', 0)
# 卧室浴室数量
data['bedroom_value'] = data['style'].apply(lambda x: x[0])
data['bathroom_value'] = data['style'].apply(lambda x: x[-2])
# 价格、面积、楼层
data['price_value'] = data['price'].apply(lambda x: x[:-3])
data['area_value'] = data['area'].apply(lambda x: x[:-1])
data['floor_value'] = data['floor'].apply(lambda x: x.split('(')[-1][0])
# 租房方位朝向
def toward(x, key=''):
if key in x:
return key
else:
return 0
data['north'] = data['toward'].apply(lambda x: toward(x, '北')).replace('北', 1)
data['south'] = data['toward'].apply(lambda x: toward(x, '南')).replace('南', 1)
data['east'] = data['toward'].apply(lambda x: toward(x, '东')).replace('东', 1)
data['west'] = data['toward'].apply(lambda x: toward(x, '西')).replace('西', 1)
# 提取全部的数值数据
values_data = data[['sitting_room_value', 'bedroom_value',
'bathroom_value', 'price_value', 'area_value',
'floor_value', 'north',
'south', 'east', 'west']].astype(float)
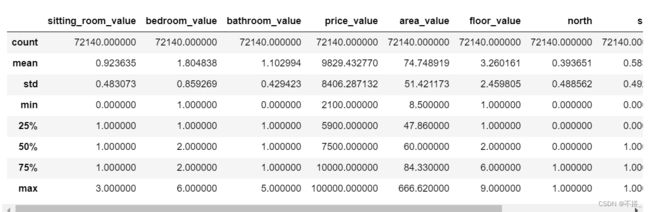
# 描述性统计
values_data.describe()
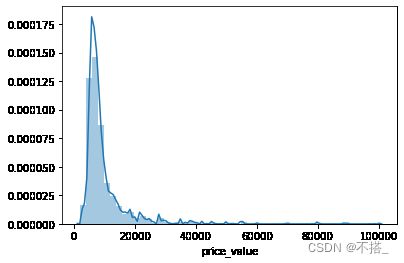
可以看出租房数据有43372条,一共10个维度。价格平均水平是11370,中位数为8200,所有价格的区间在2500-105000
4.2.数据分析部分
# 步骤8 数据分析:使用seaborn进行简单数据可视化
# 8.1 分析价格分布
sns.distplot(values_data['price_value'], kde=True)
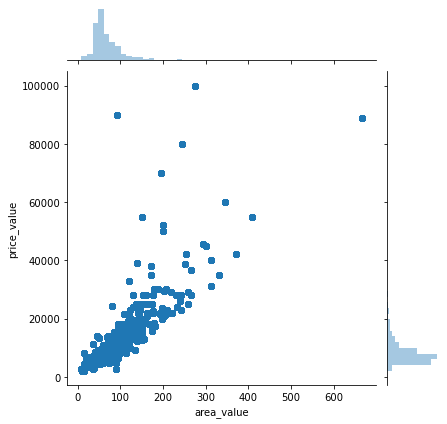
# 8.2 分析价格与其他变量的关系
# 这里只列举了价格与面积的关系
sns.jointplot(x='area_value', y='price_value', data=values_data)
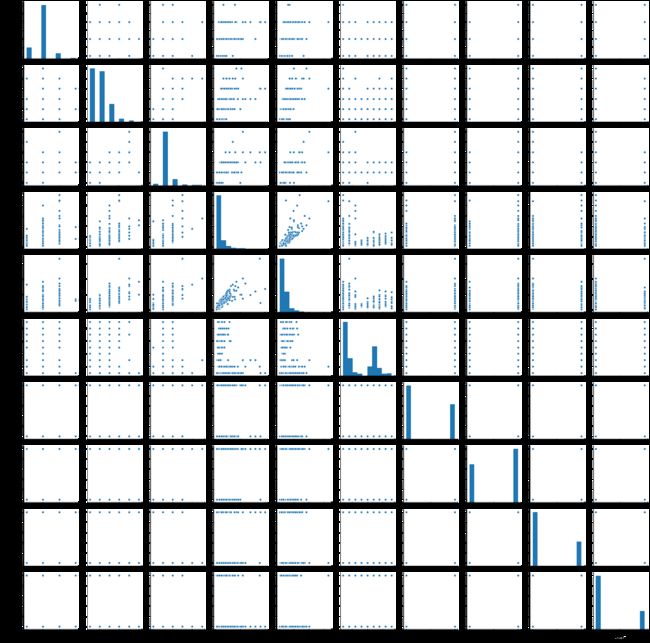
# 8.3 分析各因素之间可能存在的关系
sns.pairplot(values_data)
# 步骤9 数据分析:分位数回归
mod = smf.quantreg('price_value ~ area_value', values_data)
res = mod.fit(q=.5)
quantiles = np.arange(.05, .96, .1)
def fit_model(q):
res = mod.fit(q=q)
return [q, res.params['Intercept'], res.params['area_value']] + \
res.conf_int().loc['area_value'].tolist()
models = [fit_model(x) for x in quantiles]
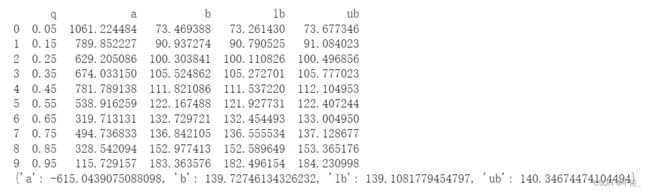
models = pd.DataFrame(models, columns=['q', 'a', 'b', 'lb', 'ub'])
ols = smf.ols('price_value ~ area_value', values_data).fit()
ols_ci = ols.conf_int().loc['area_value'].tolist()
ols = dict(a = ols.params['Intercept'],
b = ols.params['area_value'],
lb = ols_ci[0],
ub = ols_ci[1])
print(models)
print(ols)
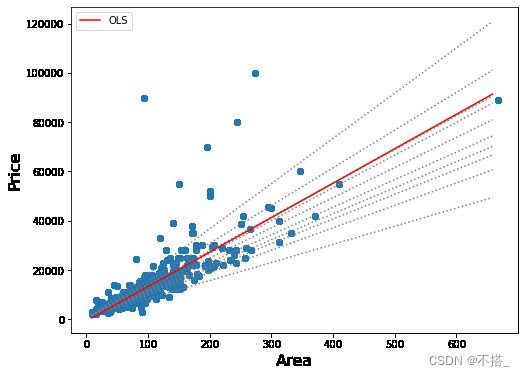
x = np.arange(values_data.area_value.min(), values_data.area_value.max(), 50)
get_y = lambda a, b: a + b * x
fig, ax = plt.subplots(figsize=(8, 6))
for i in range(models.shape[0]):
y = get_y(models.a[i], models.b[i])
ax.plot(x, y, linestyle='dotted', color='grey')
y = get_y(ols['a'], ols['b'])
ax.plot(x, y, color='red', label='OLS')
ax.scatter(values_data.area_value, values_data.price_value, alpha=.2)
legend = ax.legend()
ax.set_xlabel('Area', fontsize=16)
ax.set_ylabel('Price', fontsize=16);