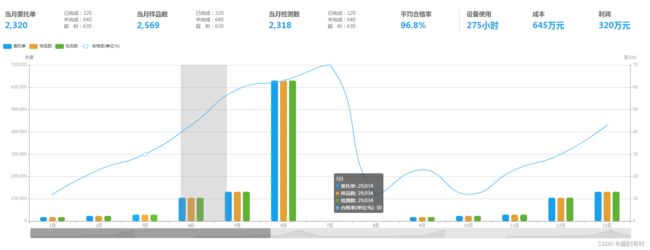
漏刻有时数据可视化大屏(16)数据指标KPI和柱图折线图混排
CSS样式表
/*面板*/
.pannel {
    width: 100%;
    margin-top: 30px;
    clear: both;
}

.item_l {
    float: left;
    width: 20%; /*3格=60%*/
    margin: 0;
}

.item_r {
    float: left;
    width: 10%; /*4格=40%*/
    margin: 0;
}

.item_child {
    float: left;
    width: 50%;
}

.item_child_b {
    float: left;
    width: 100%;
}

.item_title {
    font-size: 18px;
    font-weight: bold;
    margin-left: 20px;
}

.item_num {
    margin: 5px 20px;
    font-size: 24px;
    font-weight: bold;
    color: #18a1e9;
}

.item_norm {
    font-size: 14px;
    font-weight: 500;
}

.divider {
    border-right: 1px solid #C5C7CA;
}
HTML布局
<div class="pannel">
    <div class="item_l">
        <div class="item_child">
            <p class="item_title">当月委托单p>
            <p class="item_num" id="zb1">1320p>
        div>
        <div class="item_child">
            <p class="item_norm">已完成:320p>
            <p class="item_norm">未完成:640p>
            <p class="item_norm">超 时:630p>
        div>
    div>

    <div class="item_l">
        <div class="item_child">
            <p class="item_title">当月样品数p>
            <p class="item_num" id="zb2">1320p>
        div>
        <div class="item_child">
            <p class="item_norm">已完成:320p>
            <p class="item_norm">未完成:640p>
            <p class="item_norm">超 时:630p>
        div>
    div>

    <div class="item_l">
        <div class="item_child">
            <p class="item_title">当月检测数p>
            <p class="item_num" id="zb3">1320p>
        div>
        <div class="item_child">
            <p class="item_norm">已完成:320p>
            <p class="item_norm">未完成:640p>
            <p class="item_norm">超 时:630p>
        div>
    div>

    <div class="item_r divider">
        <div class="item_child_b">
            <p class="item_title">平均合格率p>
            <p class="item_num"><label id="zb4">label>%p>
        div>
    div>
    <div class="item_r">
        <div class="item_child_b">
            <p class="item_title">设备使用p>
            <p class="item_num"><label id="zb5">label>小时p>
        div>
    div>

    <div class="item_r">
        <div class="item_child_b">
            <p class="item_title">成本p>
            <p class="item_num"><label id="zb6">label>万元p>
        div>
    div>

    <div class="item_r">
        <div class="item_child_b">
            <p class="item_title">利润p>
            <p class="item_num"><label id="zb7">label>万元p>
        div>
    div>
div>


<div class="pannel">
    <div id="echart1" style="width:100%;height: 600px;">div>
div>
Echarts图表
/*Echarts图表封装函数*/
function getDetailLine(id) {
    var myChart = echarts.init(document.getElementById(id));
    var option = {
        tooltip: {
            trigger: 'axis',
            axisPointer: {
                type: 'shadow'
            }
        },
        grid: {
            top: '16%',
            right: '3%',
            left: '2%',
            bottom: '5%',
            containLabel: true
        },
        dataZoom: [{
            show: true,
            start: 0,
            end: 40,
            bottom: 0,
            handleSize: '40%',
            backgroundColor: 'rgba(0,0,0,0.1)',
            fillerColor: 'rgba(0,0,0,0.3)'
        }],
        legend: {
            data: ['委托单', '样品数', '检测数', '合格率(单位:%)'],
            left: '10',
            top: '5%'
        },
        xAxis: {
            type: 'category',
            boundaryGap: true,
            axisLabel: {
                show: true,
                textStyle: {color: 'rgba(0,0,0,.6)'}
            },
            axisLine: {lineStyle: {color: 'rgba(0,0,0,0.5)'}},
            data: ['1日', '2日', '3日', '4日', '5日', '6日', '7日', '8日', '9日', '10日', '11日', '12日', '13日', '14日', '15日', '16日', '17日', '18日', '19日', '20日', '21日', '22日', '23日', '24日', '25日', '26日', '27日', '28日', '29日', '30日']
        },
        yAxis: [
            {
                type: "value",
                name: "数量",
                axisLabel: {show: true},
                axisLine: {lineStyle: {color: 'rgba(0,0,0,0.5)'}},
                splitLine: {show: true, lineStyle: {color: 'rgba(0,0,0,.2)'}}
            },
            {
                type: "value",
                name: "百分比",
                axisLabel: {show: true},
                axisLine: {lineStyle: {color: 'rgba(0,0,0,0.5)'}},
                splitLine: {show: false}
            },
        ],
        series: [{
            name: '委托单',
            yAxisIndex: 0,
            type: 'bar',
            barWidth: '15%',
            itemStyle: {
                color: "#18a1e9",
                barBorderRadius: 5,
            },
            data: [18203, 23489, 29034, 104970, 131744, 630230, "", "", 18203, 23489, 29034, 104970, 131744, 630230, 29034, 18203, 23489, 29034, 104970, 131744, 630230, "", "", 18203, 23489, 29034, 104970, 131744, 630230, 29034]
        }, {
            name: '样品数',
            yAxisIndex: 0,
            type: 'bar',
            barWidth: '15%',
            itemStyle: {
                color: "#e2a236",
                barBorderRadius: 5,
            },
            data: [18203, 23489, 29034, 104970, 131744, 630230, "", "", 18203, 23489, 29034, 104970, 131744, 630230, 29034, 18203, 23489, 29034, 104970, 131744, 630230, "", "", 18203, 23489, 29034, 104970, 131744, 630230, 29034]
        }, {
            name: '检测数',
            yAxisIndex: 0,
            type: 'bar',
            barWidth: '15%',
            itemStyle: {
                color: "#60b234",
                barBorderRadius: 5,
            },
            data: [18203, 23489, 29034, 104970, 131744, 630230, "", "", 18203, 23489, 29034, 104970, 131744, 630230, 29034, 18203, 23489, 29034, 104970, 131744, 630230, "", "", 18203, 23489, 29034, 104970, 131744, 630230, 29034]
        }, {
            name: '合格率(单位:%)',
            yAxisIndex: 1,
            symbolSize: 6,
            itemStyle: {
                color: "#53bafc",
            },
            lineStyle: {
                color: "#53bafc",
            },
            data: [12, 23, 30, 43, 59, 63, 70, 12, 23, 12, 23, 30, 43, 59, 63, 70, 12, 23, 12, 23, 30, 43, 59, 63, 70, 12, 23, 70, 12, 23],
            type: 'line',
            smooth: true
        }]
    };

    myChart.setOption(option);
    window.addEventListener("resize", function () {
        myChart.resize();
    });
}
数据指标
  //数据指标;
    rollNum("zb1", 0, "2320", 0);
    rollNum("zb2", 0, "2569", 0);
    rollNum("zb3", 0, "2318", 0);
    rollNum("zb4", 0, "96.8", 1);
    rollNum("zb5", 0, "275", 0);
    rollNum("zb6", 0, "645", 0);
    rollNum("zb7", 0, "320", 0);
    //渲染图表;
    getDetailLine("echart1");

    /*
     *elId = 目标元素的 ID;
     startVal = 开始值;
     endVal = 结束值;
     decimals = 小数位数,默认值是0;
     duration = 动画延迟秒数,默认值是2;
     */
    function rollNum(elId, startVal, endVal, decimalNum) {
        var n = decimalNum || 0;
        var countUp = new CountUp(elId, startVal, endVal, n, 2.5, {
            useEasing: true, // 使用缓和
            useGrouping: true, // 使用分组(是否显示千位分隔符,一般为 true)
            separator: ',',// 分隔器(千位分隔符,默认为',')
            decimal: '.',// 十进制(小数点符号,默认为 '.')
            prefix: '',	            // 字首(数字的前缀,根据需要可设为 $,¥,¥ 等)
            suffix: ''              // 后缀(数字的后缀 ,根据需要可设为 元,个,美元 等)

        });

        if (!countUp.error) {
            countUp.start();
        } else {
            console.error(countUp.error);
        }
    }
@漏刻有时