使用 ONLYOFFICE 宏监测空气质量数据
ONLYOFFICE 宏让我们的生活更为轻松。它们助力我们自动执行日常任务,处理海量数据。但如果我们想更上一层楼,给它们添加更多功能,会怎么样?在这篇博文中,我们会把一个 ONLYOFFICE 宏的样本转换成一个宏,来监测和分析所选地区的当前空气质量。
关于 ONLYOFFICE 宏
如果您是一名资深 Microsoft Excel 用户,那么相信您已对于 VBA 宏非常熟悉了。这些宏是帮助您自动执行日常任务的小型脚本。无论是重构数据,还是在单元格区域中插入多个值。ONLYOFFICE 宏的基础是 JavaScript 语法与文档生成器 API 方法。基于 JavaSript 的宏易于使用,具有跨平台特性且十分安全。这就使得其与 VBA 相比有着显著的优势。
ONLYOFFICE 文档免费在线宏课程
近期,我们将开始发布有关 ONLYOFFICE 解决方案的免费视频课程。首个视频课程将关注 ONLYOFFICE 文档中的宏,现已在 YouTube 上提供。
本课程分为 4 节,每节时长大约在 5-10 分钟。您将了解宏的工作原理,以及一些实际的例子。为了方便起见,我们还在视频描述中添加了时间戳 – 只需点击一下即可转到您感兴趣的主题。
阅读这篇文章,了解更多。
空气质量 API
ONLYOFFICE 宏基于 JavaScript。这对我们来说是好事,因为它们支持发送 API 请求,我们可以使用这些请求来检索空气质量数据。
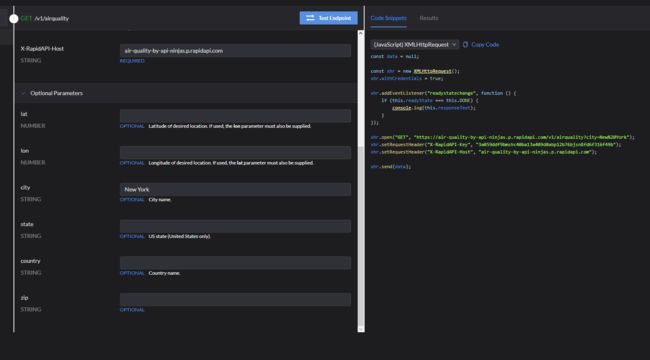
因此,第一步是要选择合适的 API。为方便起见,我们使用了 Rapid API 平台。它提供不同开发者的多个 API。此外,每个 API 都附带一个代码段。这一功能非常方便、省时。我们选择了 API-Ninjas 发布的“空气质量 API”。这款产品是免费的,没有请求上限。由于我们需要处理多个 API 请求,“空气质量 API”是我们项目的完美之选。
请注意!每个 API 都提供唯一的访问密钥供您使用。为了保持性能稳定,我们强烈建议您使用自己的 API 密钥。
构建宏
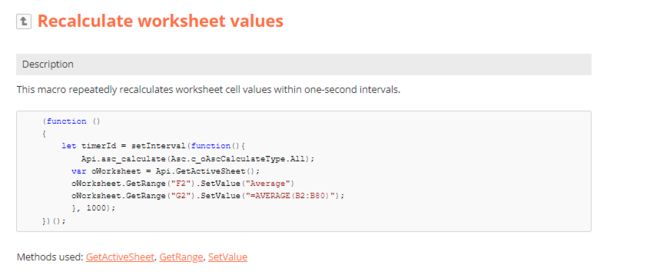
首先,我们来解决另一个问题。我们希望我们的宏实时显示当前的空气质量数据,而这需要在特定间隔内发送重复的 API 请求。我们在“重新计算工作表单元格值”的宏中实现了类似的解决方案,在我们 API 文档的宏示例部分。该宏使用本地的 Api.asc_calculate 方法,在 1 秒的间隔内重新计算整个文档。我们会利用这一功能来使用数据监控。
现在,我们可以在此重新计算间隔内构建宏。空气质量宏还会计算空气质量指数平均值。它基于来自周边三个地区的数据,会涉及发送三个 API 请求。首先,我们从纽约获得空气质量数据。我们使用 Rapid API 接口生成这个请求。我们选择“XMLHttpRequest”选项,因为它在调整请求参数方面支持更多功能:
我们只需复制、粘贴代码段,并对其进行一些细微的调整。首先,我们将“数据”变量的名称更改为“dataNewYork”。由于运行多个 API 请求,这会使我们的代码更具可读性。然后,我们将“withCredentials”选项设置为 false,让我们在运行宏时避免网络问题。我们还移除了“console.log”部分,在此处添加我们的代码:
let timerId = setInterval(function(){
            Api.asc_calculate(Asc.c_oAscCalculateType.All);
  const dataNewYork = null;
  const xhrNewYork = new XMLHttpRequest();
            xhrNewYork.withCredentials = false;

          xhrNewYork.addEventListener("readystatechange", function () {
            if (this.readyState === this.DONE) {
   }
          });
xhrNewYork.open("GET", "https://air-quality-by-api-ninjas.p.rapidapi.com/v1/airquality?city=New%20York");
xhrNewYork.setRequestHeader("X-RapidAPI-Key", "3a059ddf9bmshc40ba13a409d0abp12b76bjsn8fd6f316f49b")
xhrNewYork.setRequestHeader("X-RapidAPI-Host", "air-quality-by-api-ninjas.p.rapidapi.com");
xhrNewYork.send(dataNewYork);

  }, 10000);
我们的宏显示了一氧化碳、二氧化氮、臭氧、二氧化硫、PM2.5、PM10 浓度和整体 AQI。所以,我们需要从 JSON 中提取这一数据:
const arr = [];
              arr.push(co, no2, O3, so2, pm25, pm10, overall_aqi);
xhrNewYork.addEventListener("readystatechange", function () {
if (this.readyState === this.DONE) {
const oData = JSON.parse(xhrNewYork.responseText);
const co = oData.CO.concentration;
const no2 = oData.NO2.concentration;
const O3 = oData.O3.concentration;
const so2 = oData.SO2.concentration;
const pm25 = oData['PM2.5'].concentration;
const pm10 = oData.PM10.concentration;
const overall_aqi = oData.overall_aqi;
}
});然后我们将这些变量传入一个数组中:
const arr = [];
              arr.push(co, no2, O3, so2, pm25, pm10, overall_aqi);
稍后,我们会使用此数组将检索到的空气质量值插入到电子表格单元格中。但在此之前,我们先给这些值加上标签。为了实现这一点,我们获得活动的电子表格,然后我们确定单元格的目标,并使用 SetValue 方法向其中插入文本,再执行 AutoFit 方法来调整单元格的大小:
 const oWorksheet = Api.GetActiveSheet();
              oWorksheet.GetRange("A1").SetValue("CO:");
              oWorksheet.GetRange("A2").SetValue("NO2:");
              oWorksheet.GetRange("A3").SetValue("O3:");
              oWorksheet.GetRange("A4").SetValue("SO2:");
              oWorksheet.GetRange("A5").SetValue("PM2.5:");
              oWorksheet.GetRange("A6").SetValue("PM10:");
              oWorksheet.GetRange("A7").SetValue("OVERALL AQI:");
              oWorksheet.GetRange("A1:A7").AutoFit(false, true);
现在,我们将空气质量值插入相邻的单元格:
let nRow = 0;
              for (let i = 0; i < arr.length; i++) {
          const text = JSON.stringify(arr[i]);
              oWorksheet.GetRangeByNumber(nRow, 1).SetValue(text);
          nRow++;
              }
为了节约时间,我们在这里用了个小技巧:我们只迭代了数组,而不是对每个值使用 SetValue 方法。为此,我们添加了用作索引的“nRow”变量,并使用 GetRangeByNumber 方法来选择该行。每次迭代时,我们递增“nRow”变量以切换到下一行。我们迭代数组中的每个元素,将其转换为字符串,并使用 SetValue 方法将值插入到选定的行中。
另一个很棒的功能是在电子表格中添加图表,让数据显示更为直观。我们通过使用 AddChart 方法来处理:
  let nRow = 0;
              for (let i = 0; i < arr.length; i++) {
          const text = JSON.stringify(arr[i]);
              oWorksheet.GetRangeByNumber(nRow, 1).SetValue(text);
          nRow++;
}这就是我们的第一个 API 请求。不过,我们的目标是计算周边地区的平均 AQI。为处理这个问题,我们将使用特伦顿和哈特福德的 API 数据,并使用一个公式来计算平均值。但首先,我们需要收到这些数据,所以我们又添加了两个 API 请求。
特伦顿:
const dataTrenton = null;
          const xhrTrenton = new XMLHttpRequest();
          xhrTrenton.withCredentials = false;

          xhrTrenton.addEventListener("readystatechange", function () {
            if (this.readyState === this.DONE) {
          const oData = JSON.parse(xhrTrenton.responseText);
          const co = oData.CO.concentration;
          const no2 = oData.NO2.concentration;
          const O3 = oData.O3.concentration;
          const so2 = oData.SO2.concentration;
          const pm25 = oData['PM2.5'].concentration;
          const pm10 = oData.PM10.concentration;
          const overall_aqi = oData.overall_aqi;
          const arr = [];
              arr.push(co, no2, O3, so2, pm25, pm10, overall_aqi);

          const oWorksheet = Api.GetActiveSheet();
              oWorksheet.GetRange("J1").SetValue("CO:");
              oWorksheet.GetRange("J2").SetValue("NO2:");
              oWorksheet.GetRange("J3").SetValue("O3:");
              oWorksheet.GetRange("J4").SetValue("SO2:");
              oWorksheet.GetRange("J5").SetValue("PM2.5:");
              oWorksheet.GetRange("J6").SetValue("PM10:");
              oWorksheet.GetRange("J7").SetValue("OVERALL AQI:");
              oWorksheet.GetRange("J1:K7").AutoFit(false, true);

          let nRow = 0;
              for (let i = 0; i < arr.length; i++) {
          const text = JSON.stringify(arr[i]);
              oWorksheet.GetRangeByNumber(nRow, 10).SetValue(text);
          nRow++;
              }

          const oChart = oWorksheet.AddChart("'Sheet1'!$J$1:$K$7", true, "bar3D", 2, 100 * 36000, 70 * 36000, 11, 2 * 36000, 0, 3 * 36000);
              oChart.SetTitle("Trenton AQI", 13);
              oChart.ApplyChartStyle(5);
            }
          });
哈特福德:
const dataTrenton = null;
          const xhrTrenton = new XMLHttpRequest();
          xhrTrenton.withCredentials = false;

          xhrTrenton.addEventListener("readystatechange", function () {
            if (this.readyState === this.DONE) {
          const oData = JSON.parse(xhrTrenton.responseText);
          const co = oData.CO.concentration;
          const no2 = oData.NO2.concentration;
          const O3 = oData.O3.concentration;
          const so2 = oData.SO2.concentration;
          const pm25 = oData['PM2.5'].concentration;
          const pm10 = oData.PM10.concentration;
          const overall_aqi = oData.overall_aqi;
          const arr = [];
              arr.push(co, no2, O3, so2, pm25, pm10, overall_aqi);

          const oWorksheet = Api.GetActiveSheet();
              oWorksheet.GetRange("J1").SetValue("CO:");
              oWorksheet.GetRange("J2").SetValue("NO2:");
              oWorksheet.GetRange("J3").SetValue("O3:");
              oWorksheet.GetRange("J4").SetValue("SO2:");
              oWorksheet.GetRange("J5").SetValue("PM2.5:");
              oWorksheet.GetRange("J6").SetValue("PM10:");
              oWorksheet.GetRange("J7").SetValue("OVERALL AQI:");
              oWorksheet.GetRange("J1:K7").AutoFit(false, true);

          let nRow = 0;
              for (let i = 0; i < arr.length; i++) {
          const text = JSON.stringify(arr[i]);
              oWorksheet.GetRangeByNumber(nRow, 10).SetValue(text);
          nRow++;
              }

          const oChart = oWorksheet.AddChart("'Sheet1'!$J$1:$K$7", true, "bar3D", 2, 100 * 36000, 70 * 36000, 11, 2 * 36000, 0, 3 * 36000);
              oChart.SetTitle("Trenton AQI", 13);
              oChart.ApplyChartStyle(5);
            }
          });
最后,我们取所有三个“整体 AQI”值,并对它们应用一个公式:
const oWorksheet = Api.GetActiveSheet();
              oWorksheet.GetRange("N18").SetValue("Average AQI:");
              oWorksheet.GetRange("O18").SetValue("=AVERAGE(B7:K7:U7)");
              oWorksheet.GetRange("N18:O18").AutoFit(false, true);
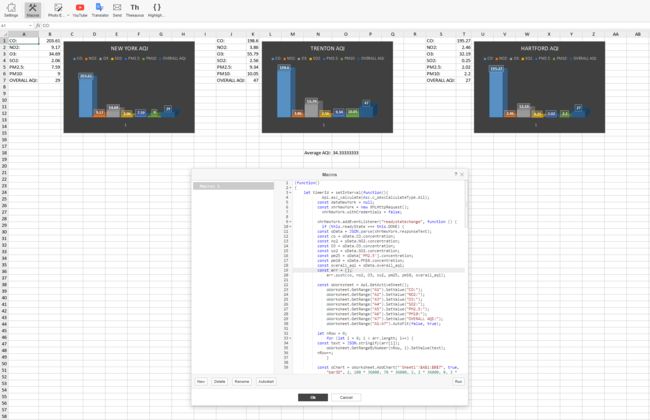
整个宏代码如下:
(function()
{
    let timerId = setInterval(function(){
            Api.asc_calculate(Asc.c_oAscCalculateType.All);

    // New York air quality API request:
          const dataNewYork = null;
          const xhrNewYork = new XMLHttpRequest();
            xhrNewYork.withCredentials = false;

          xhrNewYork.addEventListener("readystatechange", function () {
            if (this.readyState === this.DONE) {
          const oData = JSON.parse(xhrNewYork.responseText);
          const co = oData.CO.concentration;
          const no2 = oData.NO2.concentration;
          const O3 = oData.O3.concentration;
          const so2 = oData.SO2.concentration;
          const pm25 = oData['PM2.5'].concentration;
          const pm10 = oData.PM10.concentration;
          const overall_aqi = oData.overall_aqi;
          const arr = [];
              arr.push(co, no2, O3, so2, pm25, pm10, overall_aqi);

          const oWorksheet = Api.GetActiveSheet();
              oWorksheet.GetRange("A1").SetValue("CO:");
              oWorksheet.GetRange("A2").SetValue("NO2:");
              oWorksheet.GetRange("A3").SetValue("O3:");
              oWorksheet.GetRange("A4").SetValue("SO2:");
              oWorksheet.GetRange("A5").SetValue("PM2.5:");
              oWorksheet.GetRange("A6").SetValue("PM10:");
              oWorksheet.GetRange("A7").SetValue("OVERALL AQI:");
              oWorksheet.GetRange("A1:A7").AutoFit(false, true);

          let nRow = 0;
              for (let i = 0; i < arr.length; i++) {
          const text = JSON.stringify(arr[i]);
              oWorksheet.GetRangeByNumber(nRow, 1).SetValue(text);
          nRow++;
              }

          const oChart = oWorksheet.AddChart("'Sheet1'!$A$1:$B$7", true, "bar3D", 2, 100 * 36000, 70 * 36000, 2, 2 * 36000, 0, 3 * 36000);
              oChart.SetTitle("New York AQI", 13);
              oChart.ApplyChartStyle(5);
            }
          });

          xhrNewYork.open("GET", "https://air-quality-by-api-ninjas.p.rapidapi.com/v1/airquality?city=New%20York");
          xhrNewYork.setRequestHeader("X-RapidAPI-Key", "3a059ddf9bmshc40ba13a409d0abp12b76bjsn8fd6f316f49b");
          xhrNewYork.setRequestHeader("X-RapidAPI-Host", "air-quality-by-api-ninjas.p.rapidapi.com");
          xhrNewYork.send(dataNewYork);

    //Trenton air quality API request:
          const dataTrenton = null;
          const xhrTrenton = new XMLHttpRequest();
           xhrTrenton.withCredentials = false;

          xhrTrenton.addEventListener("readystatechange", function () {
            if (this.readyState === this.DONE) {
          const oData = JSON.parse(xhrTrenton.responseText);
          const co = oData.CO.concentration;
          const no2 = oData.NO2.concentration;
          const O3 = oData.O3.concentration;
          const so2 = oData.SO2.concentration;
          const pm25 = oData['PM2.5'].concentration;
          const pm10 = oData.PM10.concentration;
          const overall_aqi = oData.overall_aqi;
          const arr = [];
              arr.push(co, no2, O3, so2, pm25, pm10, overall_aqi);

          const oWorksheet = Api.GetActiveSheet();
              oWorksheet.GetRange("J1").SetValue("CO:");
              oWorksheet.GetRange("J2").SetValue("NO2:");
              oWorksheet.GetRange("J3").SetValue("O3:");
              oWorksheet.GetRange("J4").SetValue("SO2:");
              oWorksheet.GetRange("J5").SetValue("PM2.5:");
              oWorksheet.GetRange("J6").SetValue("PM10:");
              oWorksheet.GetRange("J7").SetValue("OVERALL AQI:");
              oWorksheet.GetRange("J1:K7").AutoFit(false, true);

          let nRow = 0;
              for (let i = 0; i < arr.length; i++) {
          const text = JSON.stringify(arr[i]);
              oWorksheet.GetRangeByNumber(nRow, 10).SetValue(text);
          nRow++;
              }

          const oChart = oWorksheet.AddChart("'Sheet1'!$J$1:$K$7", true, "bar3D", 2, 100 * 36000, 70 * 36000, 11, 2 * 36000, 0, 3 * 36000);
              oChart.SetTitle("Trenton AQI", 13);
              oChart.ApplyChartStyle(5);
            }
          });

          xhrTrenton.open("GET", "https://air-quality-by-api-ninjas.p.rapidapi.com/v1/airquality?city=Trenton");
          xhrTrenton.setRequestHeader("X-RapidAPI-Key", "3a059ddf9bmshc40ba13a409d0abp12b76bjsn8fd6f316f49b");
          xhrTrenton.setRequestHeader("X-RapidAPI-Host", "air-quality-by-api-ninjas.p.rapidapi.com");
          xhrTrenton.send(dataTrenton);

    //Hartford air quality API request:
          const dataHartdord = null;
          const xhrHartford = new XMLHttpRequest();
          xhrHartford.withCredentials = false;

          xhrHartford.addEventListener("readystatechange", function () {
            if (this.readyState === this.DONE) {
          const oData = JSON.parse(xhrHartford.responseText);
          const co = oData.CO.concentration;
          const no2 = oData.NO2.concentration;
          const O3 = oData.O3.concentration;
          const so2 = oData.SO2.concentration;
          const pm25 = oData['PM2.5'].concentration;
          const pm10 = oData.PM10.concentration;
          const overall_aqi = oData.overall_aqi;
          const arr = [];
              arr.push(co, no2, O3, so2, pm25, pm10, overall_aqi);

          const oWorksheet = Api.GetActiveSheet();
              oWorksheet.GetRange("S1").SetValue("CO:");
              oWorksheet.GetRange("S2").SetValue("NO2:");
              oWorksheet.GetRange("S3").SetValue("O3:");
              oWorksheet.GetRange("S4").SetValue("SO2:");
              oWorksheet.GetRange("S5").SetValue("PM2.5:");
              oWorksheet.GetRange("S6").SetValue("PM10:");
              oWorksheet.GetRange("S7").SetValue("OVERALL AQI:");
              oWorksheet.GetRange("S1:T7").AutoFit(false, true);

          let nRow = 0;
              for (let i = 0; i < arr.length; i++) {
          const text = JSON.stringify(arr[i]);
              oWorksheet.GetRangeByNumber(nRow, 19).SetValue(text);
          nRow++;
              }

          const oChart = oWorksheet.AddChart("'Sheet1'!$S$1:$T$7", true, "bar3D", 2, 100 * 36000, 70 * 36000, 20, 2 * 36000, 0, 3 * 36000);
              oChart.SetTitle("Hartford AQI", 13);
              oChart.ApplyChartStyle(5);
            }
          });

          xhrHartford.open("GET", "https://air-quality-by-api-ninjas.p.rapidapi.com/v1/airquality?city=Hartford");
          xhrHartford.setRequestHeader("X-RapidAPI-Key", "3a059ddf9bmshc40ba13a409d0abp12b76bjsn8fd6f316f49b");
          xhrHartford.setRequestHeader("X-RapidAPI-Host", "air-quality-by-api-ninjas.p.rapidapi.com");
          xhrHartford.send(dataHartdord);

          const oWorksheet = Api.GetActiveSheet();
              oWorksheet.GetRange("N18").SetValue("Average AQI:");
              oWorksheet.GetRange("O18").SetValue("=AVERAGE(B7:K7:U7)");
              oWorksheet.GetRange("N18:O18").AutoFit(false, true);


              }, 1000);
})();
现在,我们来运行宏,了解其运作方式!
我们的宏是基于JavaScript的,让它们通用性和实用性都非常强。我们支持您进行实验,并希望您利用本文中概述的概念来构建自己的宏。我们愿意展开讨论和合作,因此,如有问题,请随时提出,与我们分享您的想法或宏。祝您在探索中好运!
相关链接
ONLYOFFICE 宏上的 API
借助 ONLYOFFICE 高亮大于某个值的格子
GitHub 上的 ONLYOFFICE


