pyechars可视化大屏学习
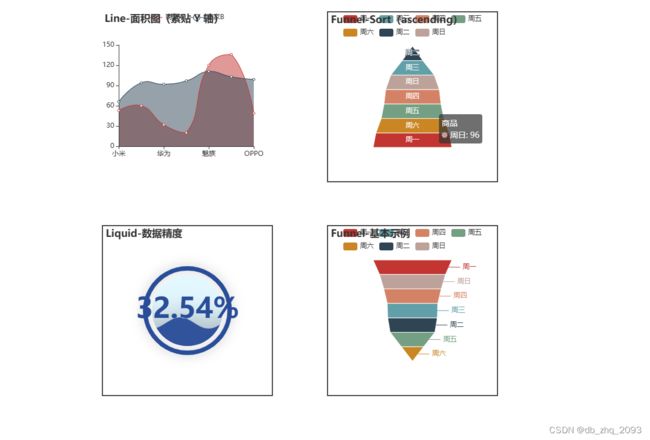
本人通过上课时候的学习与理解对pyechars的学习有了自己的一点理解,请先来看看我的成品
文章目录
- 1整体代码游览
-
- 1.1 图形的获取
- 1.2page组件的作用
- 1.3flash网页的构建
-
- 1.3.1初识flask,搭建第一个自己的网页
- 1.4网页的美化 beautifulsoup库
- 1.5总结
1整体代码游览
from pyecharts import options as opts
from pyecharts.charts import Liquid
from pyecharts.globals import SymbolType

liquid = (
    Liquid()
    .add("lq", [0.3, 0.7], is_outline_show=False, shape=SymbolType.DIAMOND)
    .set_global_opts(title_opts=opts.TitleOpts(title="Liquid-Shape-Diamond"))
)
liquid.render_notebook()


import pyecharts.options as opts
from pyecharts.charts import Line
from pyecharts.faker import Faker

line = (
    Line()
    .add_xaxis(Faker.choose())
    .add_yaxis("商家A", Faker.values())
    .add_yaxis("商家B", Faker.values())
    .set_global_opts(title_opts=opts.TitleOpts(title="Line-基本示例"))
)
line.render_notebook()


from pyecharts import options as opts
from pyecharts.charts import Bar
from pyecharts.faker import Faker

bar = (
    Bar()
    .add_xaxis(Faker.choose())
    .add_yaxis("商家A", Faker.values())
    .add_yaxis("商家B", Faker.values())
    .set_global_opts(
        title_opts=opts.TitleOpts(title="Bar-Y 轴 formatter"),
        yaxis_opts=opts.AxisOpts(axislabel_opts=opts.LabelOpts(formatter="{value} /月")),
    )
)
bar.render_notebook()


from pyecharts.charts import Pie
from datetime import datetime
now_time = datetime.now().strftime('%Y-%m-%d') # 获取当前时间
big_title = (
    Pie() # 不画图,只显示一个标题,用来构成大屏的标题
        .set_global_opts(
        title_opts=opts.TitleOpts(title="大屏标题",
                                  title_textstyle_opts=opts.TextStyleOpts(font_size=40,
#                                                                           color='#FFFFFF',
                                                                         ),
                                  subtitle = f'截至:{now_time}',
                                  pos_top=10
                                 )
        )
)
big_title.render_notebook()


from pyecharts.charts import Page

page = Page()
page.add(
    big_title,
    liquid,
    line,
    bar
)
# page.render_notebook()
page.render('page.html')


from bs4 import BeautifulSoup

with open("page.html", "r+", encoding='utf-8') as html:
    html_bf = BeautifulSoup(html, 'lxml')
    divs = html_bf.select('.chart-container') # 根据css定位标签,选中图像的父节点标签
    divs[0]["style"] = "width:420px;height:55px;position:absolute;top:20px;left:600px;border-style:dashed;border-color:#444444;border-width:0px;"
    divs[1]["style"] = "width:420px;height:274px;position:absolute;top:100px;left:30px;border-style:solid;border-color:#444444;border-width:2px;"
    divs[2]["style"] = "width:420px;height:274px;position:absolute;top:100px;left:470px;border-style:solid;border-color:#444444;border-width:2px;"
    divs[3]["style"] = "width:420px;height:274px;position:absolute;top:100px;left:910px;border-style:solid;border-color:#444444;border-width:2px;"
    body = html_bf.find("body") # 根据标签名称定位到body标签
    body["style"] = "background-color:white;" # 修改背景颜色
    html_new = str(html_bf) # 将BeautifulSoup对象转换为字符
    html.seek(0, 0) # 光标移动至
    html.truncate() # 删除光标后的所有字符内容
    html.write(html_new) # 将由BeautifulSoup对象转换得到的字符重新写入html文件


from flask import Flask
from flask import render_template

# 创建flask对象
app = Flask(__name__)

# 设置路由及其内容
@app.route('/')
def hello():
    return render_template('page.html') # html文件一定要放在templates文件夹中

if __name__ == '__main__':
    app.run(host='0.0.0.0', port=80) # 局域网电脑通过访问本机的ip地址即可访问网页
    html.close()
1.1 图形的获取
图片中的图形可以通过社区来获得
社区链接:Document
1.2page组件的作用
首先我会去想如何将多个图片排版到一个网页里面去后面通过了自己的代码的学习通过page组件将几个图形一起加入到一个网页里面去;
from pyecharts.charts import Page

page = Page()
page.add(
    big_title,#1
    liquid,#2
    line,#3
    bar#4
)
page.render('page.html')
其中#1,2,3,4是我去社区里面找的四个图形 然他们加入到一个网页里面去,我们就要用一个flash来构建一个网站。
1.3flash网页的构建
from flask import Flask
from flask import render_template

# 创建flask对象
app = Flask(__name__)


# 设置路由及其内容
@app.route('/')
def hello():
    return render_template('page.html') # html文件一定要放在templates文件夹中

if __name__ == '__main__':
    app.run(host='0.0.0.0', port=80) # 局域网电脑通过访问本机的ip地址即可访问网页
flash需要连接自己电脑的ip地址,访问的网页就是自己的ip。
1.3.1初识flask,搭建第一个自己的网页
from flask import Flask
app = Flask(__name__)

@app.route('/')
def hello_world():
    return '泥豪,世界!'

if __name__ == "__main__":
    app.run(host='127.0.0.1', port=8080)
让我们访问下网页地址:http://127.0.0.1:8080/

1.4网页的美化 beautifulsoup库
BeautifulSoup是一个可以从HTML或XML文件中提取数据的python库;它能够通过转换器实现惯用的文档导航、查找、修改文档的方式。
BeautifulSoup是一个基于re开发的解析库,可以提供一些强大的解析功能;使用BeautifulSoup能够提高提取数据的效率与爬虫开发效率。
bs 最大的特点我觉得是简单易用,不像正则和 xPath 需要刻意去记住很多特定语法,尽管那样会效率更高更直接。对大多数 python 使用者来说,好用会比高效更重要。这也是我自己使用并推荐 bs 的主要原因。
从这里我们做好了一个网站的构建和里面的图形,如果想要更好的将数据大屏排版我们需要用到beautifulsoup库(bs4)修改html文件。
代码为:
from bs4 import BeautifulSoup

with open("page.html", "r+", encoding='utf-8') as html:
    html_bf = BeautifulSoup(html, 'lxml')
    divs = html_bf.select('.chart-container') # 根据css定位标签,选中图像的父节点标签
    divs[0]["style"] = "width:420px;height:55px;position:absolute;top:20px;left:600px;border-style:dashed;border-color:#444444;border-width:0px;"
    divs[1]["style"] = "width:420px;height:274px;position:absolute;top:100px;left:30px;border-style:solid;border-color:#444444;border-width:2px;"
    divs[2]["style"] = "width:420px;height:274px;position:absolute;top:100px;left:470px;border-style:solid;border-color:#444444;border-width:2px;"
    divs[3]["style"] = "width:420px;height:274px;position:absolute;top:100px;left:910px;border-style:solid;border-color:#444444;border-width:2px;"
    body = html_bf.find("body") # 根据标签名称定位到body标签
    body["style"] = "background-color:white;" # 修改背景颜色
    html_new = str(html_bf) # 将BeautifulSoup对象转换为字符
    html.seek(0, 0) # 光标移动至
    html.truncate() # 删除光标后的所有字符内容
    html.write(html_new) # 将由BeautifulSoup对象转换得到的字符重新写入html文件
    html.close()
其中divs0,1,2,3表示的是我们加入网页中的四个图形,他的内容分别为
width:宽度、height:高/position:位置、top:高、left:离左边的距离、border-style:定义表格外观
border-color:定义表格的颜色
这些是比较主要的如果你想你的网页外观比较好看的话就要通过自己来进行排版,这样就可以形成一个比较简单的pyecharts 大屏可视化学习了
1.5总结
1、通过page组件将多个图形展示出来,生成html文件。
通过网上的继续研究我通过许多大佬的代码知道了其实可以拖动布局
改动的位置为:
def page_simple_layout():
    page = Page(layout=Page.DraggablePageLayout)
    # 将上面定义好的图添加到 page
    page.add(
        bar_datazoom_slider(),
        line_markpoint(),
        pie_rosetype(),
        table_base(),
    )
    page.render("page_simple_layout.html")
这里我是看了大佬的csdn才懂的
原创作者
2、通过beautifulsoup库修改html文件种图形位置等相关设置,将图形调整成一个合适、美观的数据大屏的形式。
3、运用flask库将html文件发布到局域网中,供其他人访问。