小程序中使用echarts配置以及折线图案例(简单易懂)
第一步:引入echarts文件--此文件需要下载:
下载地址:点击此处进行下载echarts文件
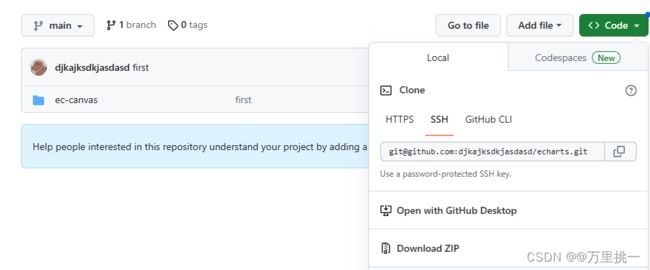
点击Download ZIP下载压缩包,注意:此文件,我是从完整的文件中剥离出来的有用的,不会影响项目。
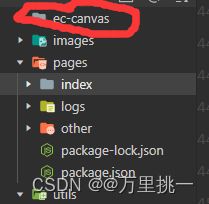
第二步:把整个文件放入到小程序文件里。
第三步:在需要的组件中进行正确引入
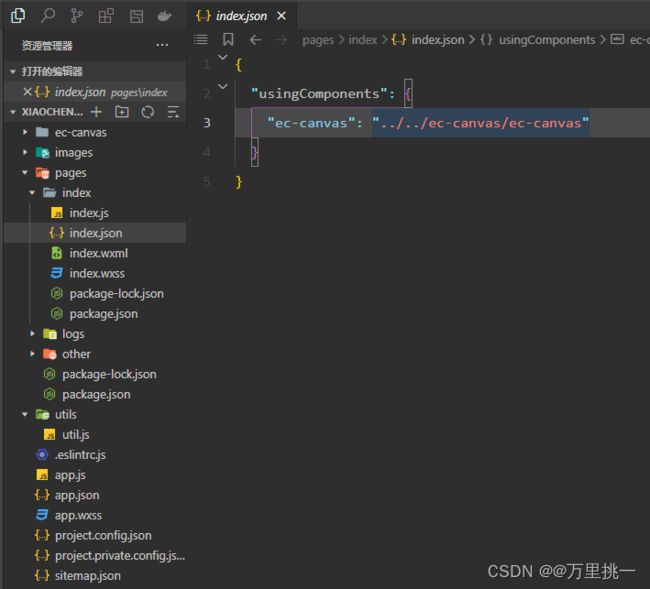
在需要使用echarts的组件的js文件里需要引入
 。
。
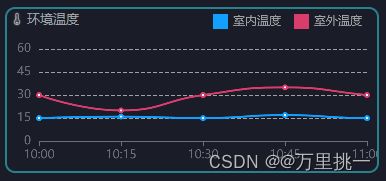
第四步:案例实现
4-1:在index.js中
import * as echarts from '../../ec-canvas/echarts';

function initChart(canvas, width, height, dpr) {
  const chart = echarts.init(canvas, null, {
    width: width,
    height: height,
    devicePixelRatio: dpr // new
  });
  canvas.setChart(chart);

  var option = {

    label: {
      normal: {
        show: true
      }
   },
    grid: {
      containLabel: true,
      x: 10, //左
      y: 40, //上
      x2: 10, //右
      y2: 10, //下
      borderWidth: 1,
    },
    legend:{
       icon:'square',
       data:['室内温度','室外温度'],
       right:'10',
       itemWidth: 15,//图标宽
       itemHeight: 15,//图标高
       itemGap: 13,//间距
       textStyle:{
         color:'#9FA0A3',
         fontSize: 12,
       },
    },
    tooltip: {
      trigger: 'axis',
      backgroundColor: 'rgba(255, 255, 255, 0.8)',
    },
    xAxis: {
      type: 'category',
      boundaryGap: false,
      data: ['10:00', '10:15', '10:30', '10:45', '11:00'],
      // show: false
    },
    yAxis: {
      type: 'value',
      min: 0,
      max: 60,
      interval: 15,
      axisLabel: {
        formatter: '{value}'
      },

      splitLine: {
        lineStyle: {
          type: 'dashed',
          color:'#9FA0A3'
        }
      }
      // show: false
    },
    series: [{
      name: '室内温度',
      type: 'line',
      smooth: true,

      data: [15, 16, 15, 17, 15, 16, 17],
      itemStyle:{
        normal:{
          color:'#12A0FF'
        }
      }
    }, {
      name: '室外温度',
      type: 'line',
      smooth: true,

      data: [30, 20, 30, 35, 30, 25, 38],
      itemStyle:{
        normal:{
          color:'#D83D6C'
        }
      }

    }, ]
  };

  chart.setOption(option);
  return chart;
}


Page({
  data: {
    ec: {
      onInit: initChart,
    },

})4.2:在index.wxml中
最后结果