Linux程序调试工具使用整理
Linux程序调试工具使用整理
GDB调试入门
GDB是GNU开源组织发布的一个强大的UNIX下的程序调试工具。或许,各位比较喜欢那种图形界面方式的,像VC、BCB等IDE的调试,但如果你是在 UNIX平台下做软件,你会发现GDB这个调试工具有比VC、BCB的图形化调试器更强大的功能。所谓“寸有所长,尺有所短”就是这个道理。一般来说,GDB主要帮忙你完成下面四个方面的功能:
- 启动你的程序
可让被调试的程序在你所指定的调置的断点处停下来
当程序被停下来看,可以检查此时你的程序中所发生的事
动态的改变你程序的执行环境
GDB是一个非常强大的调试工具,即使大家使用习惯了图形化调试工具,但这些图形化的调试工具的后端大多数都是使用 GDB 的,命令行的调试工具却有着图形化工具所不能完成的功能。以下以 hellowld.c 为例介绍 GDB 的调试入门:
- 编写代码
开始工作时,先确认在你的编程环境中是否安装了开发环境,如果未安装,参考 安装开发环境 章节完成开发环境的安装:
#include 编译代码,使用 GDB 调试程序时,在 gcc 编译时要带上 -g 参数:
gcc helloworld.c -o hellowrld -g
运行一下程序,看看效果:
thead@yoc:~/works > ./hellowrld China
Hello World China!
result = 5050
thead@yoc:~/works > ./hellowrld
helloworld.
result = 5050
- 启动调试
$ gdb helloWorld
GNU gdb (GDB) Red Hat Enterprise Linux 8.2-12.el8
Copyright (C) 2018 Free Software Foundation, Inc.
License GPLv3+: GNU GPL version 3 or later <http://gnu.org/licenses/gpl.html>
This is free software: you are free to change and redistribute it.
There is NO WARRANTY, to the extent permitted by law.
Type "show copying" and "show warranty" for details.
This GDB was configured as "x86_64-redhat-linux-gnu".
Type "show configuration" for configuration details.
For bug reporting instructions, please see:
<http://www.gnu.org/software/gdb/bugs/>.
Find the GDB manual and other documentation resources online at:
    <http://www.gnu.org/software/gdb/documentation/>.

For help, type "help".
Type "apropos word" to search for commands related to "word"...
Reading symbols from helloworld...done.
(gdb) run                  <----------------------------- 不带参数运行
Starting program: /home/zhuzhg/helloworld
Missing separate debuginfos, use: yum debuginfo-install glibc-2.28-101.el8.x86_64
helloworld.
result = 5050
[Inferior 1 (process 1069013) exited normally]
(gdb) run China            <----------------------------- 带参数运行
Starting program: /home/zhuzhg/helloworld China
Hello World China!
result = 5050
[Inferior 1 (process 1071086) exited normally]
(gdb)
- 断点
在介绍之前,我们首先需要了解,为什么需要设置断点。我们在指定位置设置断点之后,程序运行到该位置将会“暂停”,这个时候我们就可以对程序进行更多的操作,比如查看变量内容,堆栈情况等等,以帮助我们调试程序。
设置断点
文件行号断点:break hellowrld.c:9

函数断点:break main

条件断点:break helloworld.c:17 if c == 10

临时断点, 假设某处的断点只想生效一次,那么可以设置临时断点,这样断点后面就不复存在了:tbreak helleworld.c:9

禁用或启动断点:

disable                 # 禁用所有断点
disable bnum            # 禁用标号为bnum的断点
enable                  # 启用所有断点
enable bnum             # 启用标号为bnum的断点
enable delete bnum      # 启动标号为bnum的断点,并且在此之后删除该断点

断点清除:

clear                   # 删除当前行所有breakpoints
clear function          # 删除函数名为function处的断点
clear filename:function # 删除文件filename中函数function处的断点
clear lineNum           # 删除行号为lineNum处的断点
clear f:lename:lineNum  # 删除文件filename中行号为lineNum处的断点
delete                  # 删除所有breakpoints,watchpoints和catchpoints
delete bnum             # 删除断点号为bnum的断点
- 变量查看
在启动调试以及设置断点之后,就到了我们非常关键的一步-查看变量。GDB调试最大的目的之一就是走查代码,查看运行结果是否符合预期。既然如此,我们就不得不了解一些查看各种类型变量的方法,以帮助我们进一步定位问题。
变量查看: 最常见的使用便是使用print(可简写为p)打印变量内容。
以上述程序为例:
gdb helloworld
break helloworld.c:17 if i == 0
(gdb) run
Starting program: /home/zhuzhg/helloworld
helloworld.

Breakpoint 2, main (argc=1, argv=0x7fffffffdca8) at helloworld.c:17
17            result += i;
(gdb) print i                <------------------ 查看变量 i 当前的值
$1 = 10
(gdb) print result           <------------------ 查看变量 result 当前的值
$2 = 45
(gdb) print argc             <------------------ 查看变量 argc 当前的值
$3 = 1
(gdb) print str
$4 = 0x4006c8 "Helleo World" <------------------ 查看变量 str 当前的值
- 查看内存: examine(简写为x)可以用来查看内存地址中的值。语法如下:
x/[n][f][u] addr
其中:
n 表示要显示的内存单元数,默认值为1
f 表示要打印的格式,前面已经提到了格式控制字符
u 要打印的单元长度
addr 内存地址
单元类型常见有如下:
b 字节
h 半字,即双字节
w 字,即四字节
g 八字节
示例:
(gdb) x/4b str
0x4006c8:    01001000    01100101    01101100    01101100
可以看到,变量 str 的四个字节都以二进制的方式打印出来了。
- 查看寄存器内容:
ra             0x3ff7ef2282     0x3ff7ef2282 <__libc_start_main+160>
sp             0x3ffffffaa0     0x3ffffffaa0
gp             0x2aaaaac800     0x2aaaaac800
tp             0x3ff7fdd250     0x3ff7fdd250
t0             0x3ff7ed60b0     274742468784
t1             0x3ff7ef21e2     274742583778
t2             0x2aaaaac4f0     183251944688
fp             0x3ffffffab0     0x3ffffffab0
s1             0x0      0
a0             0x1      1
a1             0x3ffffffc28     274877905960
a2             0x3ffffffc38     274877905976
a3             0x0      0
a4             0x3ffffffad8     274877905624
a5             0x0      0
a6             0x3ff7fd88a8     274743527592
(内容过多未显示完全)
- 单步调试
在启动调试设置断点观察之后,没有我们想要的信息怎么办呢?这个时候,就需要单步执行或者跳过当前断点继续执行等等。而本文所说的单步调试并非仅仅指单步执行,而是指在你的控制之下,按要求执行语句。
单步执行-next:
next命令(可简写为n)用于在程序断住后,继续执行下一条语句,假设已经启动调试,并在第12行停住,如果要继续执行,则使用n执行下一条语句,如果后面跟上数字num,则表示执行该命令num次,就达到继续执行n行的效果了:
gdb helloworld                     <------------------------------- 加载程序
(gdb) break helloworld.c:18        <------------------------------- 设置断点
(gdb) run                          <------------------------------- 启动调试
The program being debugged has been started already.
Start it from the beginning? (y or n) y
Starting program: /home/zhuzhg/helloworld
Helleo World.

Breakpoint 2, main (argc=1, argv=0x7fffffffdca8) at helloworld.c:18         <-------- 程序在 18 行暂停
18            result += i;
Breakpoint 2, main (argc=1, argv=0x7fffffffdca8) at helloworld.c:18
18            result += i;
(gdb) next                                    <--------  单步执行

17        for(i = 1; i <= 100; i++)  {

Breakpoint 2, main (argc=1, argv=0x7fffffffdca8) at helloworld.c:18
18            result += i;
(gdb) next 2                                  <--------  执行两次

Breakpoint 2, main (argc=1, argv=0x7fffffffdca8) at helloworld.c:18
18            result += i;
单步进入-step:
如果我们想跟踪add函数内部的情况,可以使用step命令(可简写为s),它可以单步跟踪到函数内部,但前提是该函数有调试信息并且有源码信息。
断点继续-continue:
我们可能打了多处断点,或者断点打在循环内,这个时候,想跳过这个断点,甚至跳过多次断点继续执行该怎么做呢?可以使用continue命令(可简写为c)或者fg,它会继续执行程序,直到再次遇到断点处。
使用 gdbserver 远程调试
使用 gdbserver 可以对目标设备上的程序进行远程调试。
安装 GDBSERVER
在 ICE-EVB 开发板上,通过下面命令来安装 GDBSEVER。
apt install gdbserver
gdbserver 用法
Usage:  gdbserver [OPTIONS] COMM PROG [ARGS ...]
        gdbserver [OPTIONS] --attach COMM PID
        gdbserver [OPTIONS] --multi COMM

COMM may either be a tty device (for serial debugging),
HOST:PORT to listen for a TCP connection, or '-' or 'stdio' to use
stdin/stdout of gdbserver.
PROG is the executable program.  ARGS are arguments passed to inferior.
PID is the process ID to attach to, when --attach is specified.

Operating modes:

  --attach              Attach to running process PID.
  --multi               Start server without a specific program, and
                        only quit when explicitly commanded.
  --once                Exit after the first connection has closed.
  --help                Print this message and then exit.
  --version             Display version information and exit.
第一步:在目标机上启动 gdbserver 服务
要进行gdb调试,首先要在目标系统上启动gdbserver服务。在gdbserver所在目录下输入命令:
gdbserver :12345 helloworld
此时gdbserver监听端口号1234,并等待客户端连接。
第二步:在宿主机上运行 GDB:
riscv64-linux-gnu-gdb helloworld

(gdb) target remote 192.168.1.4:12345
核心转储
在 Linux 系统中,常将“主内存”称为核心(core),而核心映像(core image) 就是 “进程”(process)执行当时的内存内容。当进程发生错误或收到“信号”(signal) 而终止执行时,系统会将核心映像写入一个文件,以作为调试之用,这就是所谓的核心转储(core dump)。
通常在系统收到特定的信号时由操作系统生成。信号可以由程序执行过程中的异常触发,也可以由外部程序发送。动作的结果一般是生成一个某个进程的内存转储的文件,文件包含了此进程当前的运行堆栈信息。有时程序并未经过彻底测试,这使得它在执行的时候一不小心就会找到破坏。这可能会导致核心转储(core dump)。
当在一个程序崩溃时,系统会在指定目录下生成一个core文件,我们就可以通过 core文件来对造成程序崩贵的原因进行调试定位。
开启核心转储
默认情况下,Linux 没有打开core文件生成功能,通过以下命令打开core文件的生成:
# 不限制产生 core 的大小
ulimit -c unlimited
unlimited 意思是系统不限制core文件的大小,只要有足够的磁盘空间,会转存程序所占用的全部内存,如果需要限制系统产生 core 的大小,可以使用以下命令:
# core 最大限制大小为 409600 字节
ulimit -c 409600
如果需要关装核心转储功能,只需要将限制大小设为0 即可:
ulimit -c 0
上述操作在一个终端中有效,退出或者新打开终端时无效,可以在将上述配置加入到 /etc/profile 中:
# 编辑 profile 文件
vi /etc/profile
# 将下行加到入profile 文件中
ulimit -c unlimited
使用GDB调试 core 文件
首先我们来编写一个产生错误的程序,vi test.c
#include 以上程序给一个空指令赋值,这是C语言编程中遇到的段错误,程序运行后,如果开启了核心转储后,就会产生一个 core 文件。
# 编译 test.c 生成 test 程序
gcc test.c -o test -g -MD
# 运行该程序
./test
运行后,我们可以看到 Segmentation fault (core dumped) 提示信息,表示已经在当前目录下产生了一 core 文件,通过 ls -l core 命令可以查看:
root@thead-910:~# ls -l core
-rw------- 1 root root 225280 Jan  6 10:51 core
下面我样就可以通过 core 来进行调试:
root@thead-910:~# gdb test core
GNU gdb (Debian 10.1-1.7) 10.1.90.20210103-git
Copyright (C) 2021 Free Software Foundation, Inc.
License GPLv3+: GNU GPL version 3 or later <http://gnu.org/licenses/gpl.html>
This is free software: you are free to change and redistribute it.
There is NO WARRANTY, to the extent permitted by law.
Type "show copying" and "show warranty" for details.
This GDB was configured as "riscv64-linux-gnu".
Type "show configuration" for configuration details.
For bug reporting instructions, please see:
<https://www.gnu.org/software/gdb/bugs/>.
Find the GDB manual and other documentation resources online at:
    <http://www.gnu.org/software/gdb/documentation/>.

For help, type "help".
Type "apropos word" to search for commands related to "word"...
Reading symbols from test...
[New LWP 1134]
Core was generated by `./test'.
Program terminated with signal SIGSEGV, Segmentation fault.
#0  0x0000002ae6775600 in main (argc=1, argv=0x3fffb22d18) at test.c:9
9        *p = 100;
通过 GDB 可以看到程序的第9行出错。
如果我们想一步步调试,那么可以在gdb中打断点(b),然后运行®,或者一步步(s)调试,
(gdb) b test.c:9
Breakpoint 1 at 0x2ae67755f8: file test.c, line 9.
(gdb) r
Starting program: /root/test

Breakpoint 1, main (argc=1, argv=0x3ffffffce8) at test.c:9
9        *p = 100;
(gdb) p p
$1 = (int *) 0x0
(gdb) n

Program received signal SIGSEGV, Segmentation fault.
0x0000002aaaaaa600 in main (argc=1, argv=0x3ffffffce8) at test.c:9
9        *p = 100;
(gdb) quit
A debugging session is active.

        Inferior 1 [process 1198] will be killed.

Quit anyway? (y or n) y
使用 GDB 调式 core 的命令格式如下:
gdb <程序> <core文件>
KGDB 内核调试指南
内核有两个不同的调试器前端(kdb和kgdb),它们连接到调试核心。如果在编译和运行时正确配置了内核,则可以使用两个调试器前端中的任何一个并在它们之间动态转换。
Kdb是简单化的shell风格的界面,可以在带有键盘或串行控制台的系统控制台上使用。您可以使用它来检查内存,寄存器,进程列表,dmesg,甚至设置断点以停在特定位置。尽管您可以设置断点并执行一些基本的内核运行控制,但Kdb并不是源代码级调试器。 Kdb主要旨在进行一些分析,以帮助开发或诊断内核问题。如果代码是使用CONFIG_KALLSYMS构建的,则可以按名称访问内核内置文件或内核模块中的某些符号。
Kgdb旨在用作Linux内核的源代码级调试器。它与gdb一起用于调试Linux内核。期望gdb可用于“侵入”内核以检查内存,变量并查看调用堆栈信息,类似于应用程序开发人员使用gdb调试应用程序的方式。可以在内核代码中放置断点并执行一些有限的执行步骤。
使用kgdb需要两台机器。其中一台机器是开发机器,另一台是目标机器。要调试的内核在目标计算机上运行。开发机器针对包含符号的vmlinux文件运行gdb实例(不是启动映像,如bzImage,zImage,uImage…)。在gdb中,开发人员指定连接参数并连接到kgdb。开发人员与gdb建立的连接类型取决于在测试计算机内核中编译为内置模块或可加载内核模块的kgdb I / O模块的可用性。
编译内核
在 menuconfig 中开启 CONFIG_KGDB
Symbol: KGDB [=y]
Type  : bool
Defined at lib/Kconfig.kgdb:11
  Prompt: KGDB: kernel debugger
  Depends on: HAVE_ARCH_KGDB [=y] && DEBUG_KERNEL [=y]
   Location:
     -> Kernel hacking
 (1)   -> Generic Kernel Debugging Instruments
LOCKDEP
- 简介
验证程序操作的基本对象是锁的类型。
一类锁是一组在锁规则上逻辑上相同的锁,即使锁可能具有多个(可能是数万个)实例化。 例如,inode结构中的锁是一个类,而每个inode具有该锁类的自己的实例化。
验证器跟踪锁类的“状态”,并跟踪不同锁类之间的依赖关系。 验证器保持状态和依赖关系正确的滚动证明。
锁实例化不同,锁类本身永远不会消失:在启动后首次使用锁类时,它将被注册,并且该锁类的所有后续使用都将附加到该锁类上
使用介绍
在 Kernel hacking -> Lock Debuging 中开启 LOCK_DEP 测试,(注意不要开启 LOCK_STAT)
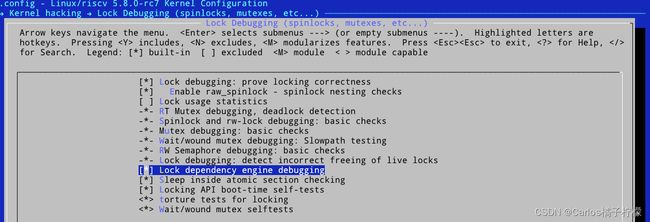
运行后,会启动自动测试
[    0.000424] Lock dependency validator: Copyright (c) 2006 Red Har
[    0.000443] ... MAX_LOCKDEP_SUBCLASSES:  8
[    0.000460] ... MAX_LOCK_DEPTH:          48
[    0.000476] ... MAX_LOCKDEP_KEYS:        8192
[    0.000492] ... CLASSHASH_SIZE:          4096
[    0.000508] ... MAX_LOCKDEP_ENTRIES:     32768
[    0.000524] ... MAX_LOCKDEP_CHAINS:      65536
[    0.000540] ... CHAINHASH_SIZE:          32768
[    0.000556]  memory used by lock dependency info: 6301 kB
[    0.000572]  memory used for stack traces: 4224 kB
[    0.000588]  per task-struct memory footprint: 1920 bytes
[    0.000604] ------------------------
[    0.000620] | Locking API testsuite:
[    0.000636] -----------------------------------------------------
[    0.000651]                                  | spin |wlock |rloc|
[    0.000667]   ---------------------------------------------------
[    0.000698]                      A-A deadlock:  ok  |  ok  |  ok|
[    0.009065]                  A-B-B-A deadlock:  ok  |  ok  |  ok|
[    0.018270]              A-B-B-C-C-A deadlock:  ok  |  ok  |  ok|
[    0.028441]              A-B-C-A-B-C deadlock:  ok  |  ok  |  ok|
[    0.038546]          A-B-B-C-C-D-D-A deadlock:  ok  |  ok  |  ok|
[    0.049592]          A-B-C-D-B-D-D-A deadlock:  ok  |  ok  |  ok|
[    0.060594]          A-B-C-D-B-C-D-A deadlock:  ok  |  ok  |  ok|
[    0.071571]                     double unlock:  ok  |  ok  |  ok|
[    0.079825]                   initialize held:  ok  |  ok  |  ok|
[    0.087588]   ---------------------------------------------------
[    0.087606]               recursive read-lock:             |  ok|
[    0.090094]            recursive read-lock #2:             |  ok|
[    0.092472]             mixed read-write-lock:             |  ok|
[    0.094807]             mixed write-read-lock:             |  ok|
[    0.097203]   mixed read-lock/lock-write ABBA:             |  ok|
[    0.099780]    mixed read-lock/lock-read ABBA:             |FAIL|
[    0.102444]  mixed write-lock/lock-write ABBA:             |  ok|
[    0.105050]   ---------------------------------------------------
[    0.105079]      hard-irqs-on + irq-safe-A/12:  ok  |  ok  |  ok|
[    0.108638]      soft-irqs-on + irq-safe-A/12:  ok  |  ok  |  ok|
[    0.112183]      hard-irqs-on + irq-safe-A/21:  ok  |  ok  |  ok|
[    0.115749]      soft-irqs-on + irq-safe-A/21:  ok  |  ok  |  ok|
[    0.119282]        sirq-safe-A => hirqs-on/12:  ok  |  ok  |  ok|
[    0.122826]        sirq-safe-A => hirqs-on/21:  ok  |  ok  |  ok|
[    0.126384]          hard-safe-A + irqs-on/12:  ok  |  ok  |  ok|
[    0.129957]          soft-safe-A + irqs-on/12:  ok  |  ok  |  ok|
[    0.133488]          hard-safe-A + irqs-on/21:  ok  |  ok  |  ok|
[    0.137056]          soft-safe-A + irqs-on/21:  ok  |  ok  |  ok|
[    0.140635]     hard-safe-A + unsafe-B #1/123:  ok  |  ok  |  ok|
[    0.144589]     soft-safe-A + unsafe-B #1/123:  ok  |  ok  |  ok|
[    0.148522]     hard-safe-A + unsafe-B #1/132:  ok  |  ok  |  ok|
[    0.152483]     soft-safe-A + unsafe-B #1/132:  ok  |  ok  |  ok|
[    0.156465]     hard-safe-A + unsafe-B #1/213:  ok  |  ok  |  ok|
[    0.160438]     soft-safe-A + unsafe-B #1/213:  ok  |  ok  |  ok|
[    0.164415]     hard-safe-A + unsafe-B #1/231:  ok  |  ok  |  ok|
[    0.168325]     soft-safe-A + unsafe-B #1/231:  ok  |  ok  |  ok|
The Kernel Address Sanitizer (KASAN)
KernelAddressSANitizer(KASAN)是动态内存错误检测器。它提供了一种快速而全面的解决方案,以查找无用后使用和越界错误。
KASAN使用编译时工具来检查每个内存访问,因此您将需要GCC 4.9.2或更高版本。需要GCC 5.0或更高版本才能检测对堆栈或全局变量的越界访问。
使用方法
在内核中开启 KASAN:
CONFIG_KASAN = y
并在CONFIG_KASAN_OUTLINE和CONFIG_KASAN_INLINE之间选择。 Outline和inline是编译器检测类型。 前者产生较小的二进制文件,而后者则快1.1-2倍。 内联检测需要GCC 5.0或更高版本。
KASAN可与SLUB和SLAB内存分配器一起使用。 为了更好地检测错误和更好地报告,请启用CONFIG_STACKTRACE。
要禁用特定文件或目录的检测,请在相应的内核Makefile中添加类似于以下内容的行:
对于单个文件 (譬如: main.o)
KASAN_SANITIZE_main.o := n
对于一个目录中的所有文件
KASAN_SANITIZE := n
出错报告
典型的越界访问报告如下所示:
==================================================================
BUG: AddressSanitizer: out of bounds access in kmalloc_oob_right+0x65/0x75 [test_kasan] at addr ffff8800693bc5d3
Write of size 1 by task modprobe/1689
=============================================================================
BUG kmalloc-128 (Not tainted): kasan error
-----------------------------------------------------------------------------

Disabling lock debugging due to kernel taint
INFO: Allocated in kmalloc_oob_right+0x3d/0x75 [test_kasan] age=0 cpu=0 pid=1689
 __slab_alloc+0x4b4/0x4f0
 kmem_cache_alloc_trace+0x10b/0x190
 kmalloc_oob_right+0x3d/0x75 [test_kasan]
 init_module+0x9/0x47 [test_kasan]
 do_one_initcall+0x99/0x200
 load_module+0x2cb3/0x3b20
 SyS_finit_module+0x76/0x80
 system_call_fastpath+0x12/0x17
INFO: Slab 0xffffea0001a4ef00 objects=17 used=7 fp=0xffff8800693bd728 flags=0x100000000004080
INFO: Object 0xffff8800693bc558 @offset=1368 fp=0xffff8800693bc720

Bytes b4 ffff8800693bc548: 00 00 00 00 00 00 00 00 5a 5a 5a 5a 5a 5a 5a 5a  ........ZZZZZZZZ
Object ffff8800693bc558: 6b 6b 6b 6b 6b 6b 6b 6b 6b 6b 6b 6b 6b 6b 6b 6b  kkkkkkkkkkkkkkkk
Object ffff8800693bc568: 6b 6b 6b 6b 6b 6b 6b 6b 6b 6b 6b 6b 6b 6b 6b 6b  kkkkkkkkkkkkkkkk
Object ffff8800693bc578: 6b 6b 6b 6b 6b 6b 6b 6b 6b 6b 6b 6b 6b 6b 6b 6b  kkkkkkkkkkkkkkkk
Object ffff8800693bc588: 6b 6b 6b 6b 6b 6b 6b 6b 6b 6b 6b 6b 6b 6b 6b 6b  kkkkkkkkkkkkkkkk
Object ffff8800693bc598: 6b 6b 6b 6b 6b 6b 6b 6b 6b 6b 6b 6b 6b 6b 6b 6b  kkkkkkkkkkkkkkkk
Object ffff8800693bc5a8: 6b 6b 6b 6b 6b 6b 6b 6b 6b 6b 6b 6b 6b 6b 6b 6b  kkkkkkkkkkkkkkkk
Object ffff8800693bc5b8: 6b 6b 6b 6b 6b 6b 6b 6b 6b 6b 6b 6b 6b 6b 6b 6b  kkkkkkkkkkkkkkkk
Object ffff8800693bc5c8: 6b 6b 6b 6b 6b 6b 6b 6b 6b 6b 6b 6b 6b 6b 6b a5  kkkkkkkkkkkkkkk.
Redzone ffff8800693bc5d8: cc cc cc cc cc cc cc cc                          ........
Padding ffff8800693bc718: 5a 5a 5a 5a 5a 5a 5a 5a                          ZZZZZZZZ
CPU: 0 PID: 1689 Comm: modprobe Tainted: G    B          3.18.0-rc1-mm1+ #98
 ffff8800693bc000 0000000000000000 ffff8800693bc558 ffff88006923bb78
 ffffffff81cc68ae 00000000000000f3 ffff88006d407600 ffff88006923bba8
 ffffffff811fd848 ffff88006d407600 ffffea0001a4ef00 ffff8800693bc558
Call Trace:
 [<ffffffff81cc68ae>] dump_stack+0x46/0x58
 [<ffffffff811fd848>] print_trailer+0xf8/0x160
 [<ffffffffa00026a7>] ? kmem_cache_oob+0xc3/0xc3 [test_kasan]
 [<ffffffff811ff0f5>] object_err+0x35/0x40
 [<ffffffffa0002065>] ? kmalloc_oob_right+0x65/0x75 [test_kasan]
 [<ffffffff8120b9fa>] kasan_report_error+0x38a/0x3f0
 [<ffffffff8120a79f>] ? kasan_poison_shadow+0x2f/0x40
 [<ffffffff8120b344>] ? kasan_unpoison_shadow+0x14/0x40
 [<ffffffff8120a79f>] ? kasan_poison_shadow+0x2f/0x40
 [<ffffffffa00026a7>] ? kmem_cache_oob+0xc3/0xc3 [test_kasan]
 [<ffffffff8120a995>] __asan_store1+0x75/0xb0
 [<ffffffffa0002601>] ? kmem_cache_oob+0x1d/0xc3 [test_kasan]
 [<ffffffffa0002065>] ? kmalloc_oob_right+0x65/0x75 [test_kasan]
 [<ffffffffa0002065>] kmalloc_oob_right+0x65/0x75 [test_kasan]
 [<ffffffffa00026b0>] init_module+0x9/0x47 [test_kasan]
 [<ffffffff810002d9>] do_one_initcall+0x99/0x200
 [<ffffffff811e4e5c>] ? __vunmap+0xec/0x160
 [<ffffffff81114f63>] load_module+0x2cb3/0x3b20
 [<ffffffff8110fd70>] ? m_show+0x240/0x240
 [<ffffffff81115f06>] SyS_finit_module+0x76/0x80
 [<ffffffff81cd3129>] system_call_fastpath+0x12/0x17
Memory state around the buggy address:
 ffff8800693bc300: fc fc fc fc fc fc fc fc fc fc fc fc fc fc fc fc
 ffff8800693bc380: fc fc 00 00 00 00 00 00 00 00 00 00 00 00 00 fc
 ffff8800693bc400: fc fc fc fc fc fc fc fc fc fc fc fc fc fc fc fc
 ffff8800693bc480: fc fc fc fc fc fc fc fc fc fc fc fc fc fc fc fc
 ffff8800693bc500: fc fc fc fc fc fc fc fc fc fc fc 00 00 00 00 00
>ffff8800693bc580: 00 00 00 00 00 00 00 00 00 00 03 fc fc fc fc fc
                                             ^
 ffff8800693bc600: fc fc fc fc fc fc fc fc fc fc fc fc fc fc fc fc
 ffff8800693bc680: fc fc fc fc fc fc fc fc fc fc fc fc fc fc fc fc
 ffff8800693bc700: fc fc fc fc fb fb fb fb fb fb fb fb fb fb fb fb
 ffff8800693bc780: fb fb fb fb fb fb fb fb fb fb fb fb fb fb fb fb
 ffff8800693bc800: fb fb fb fb fb fb fb fb fb fb fb fb fb fb fb fb
==================================================================
该报告的标题描述了发生了哪种错误以及导致这种错误的访问方式。后面是对访问的slub对象的描述(有关详细信息,请参见 Documentation/vm/slub.txt 中的 “ SLUB调试输出” 部分)以及对访问的内存页面的描述。
在最后一部分中,报告显示访问地址周围的内存状态。阅读此部分需要对KASAN的工作方式有一些了解。
存储器的每8个对齐字节的状态被编码在一个影子字节中。这8个字节可以访问,部分访问,释放或为redzone。对于每个影子字节,我们使用以下编码:0表示相应存储区的所有8个字节均可访问; N(1 <= N <= 7)表示前N个字节是可访问的,而其他(8-N)个字节则不可访问;任何负值表示整个8字节字不可访问。我们使用不同的负值来区分不同类型的不可访问的内存,例如Redzone或释放的内存(请参见mm / kasan / kasan.h)。
在报告上方的箭头指向影子字节03,这意味着被访问的地址可以部分访问。
本文参考: https://www.kernel.org/doc/html/v4.14/dev-tools/kasan.html
Perf 使用手册
参考链接
Kprobe & Uprobe - Linux Tracing
参考链接