QCustomPlot 添加曲线、添加图例等常用功能
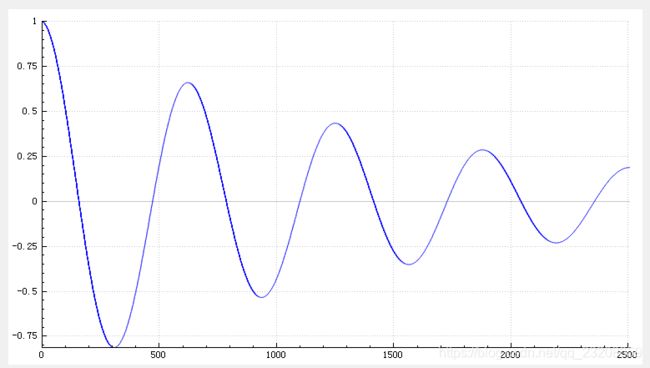
1、添加一条曲线
    ui->customPlot->addGraph();
    QVector<double> x(2510), y0(2510);
    for (int i=0; i<2500; ++i)
    {
      x[i] = i;
      y0[i] = qExp(-i/1500.0)*qCos(i/100.0);
    }
    ui->customPlot->graph(0)->setData(x, y0);

2、坐标轴自适应曲线
ui->customPlot->graph(0)->rescaleAxes();
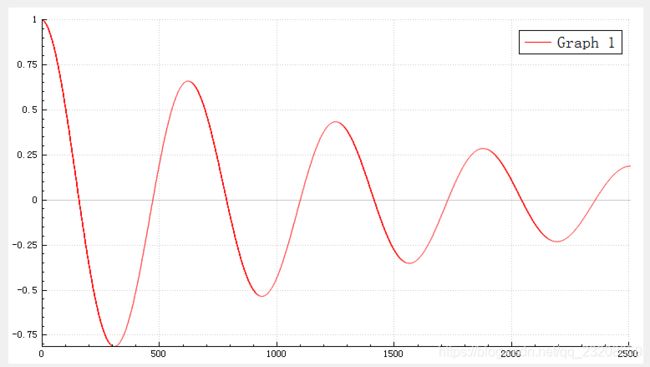
3、改变曲线的颜色
ui->customPlot->graph(0)->setPen(QPen(Qt::red));

4、添加图例
ui->customPlot->legend->setVisible(true);

5、设置图例字体
ui->customPlot->legend->setFont(QFont("Helvetica",14));
5、设置图例图标大小
ui->customPlot->legend->setIconSize(100, 20);

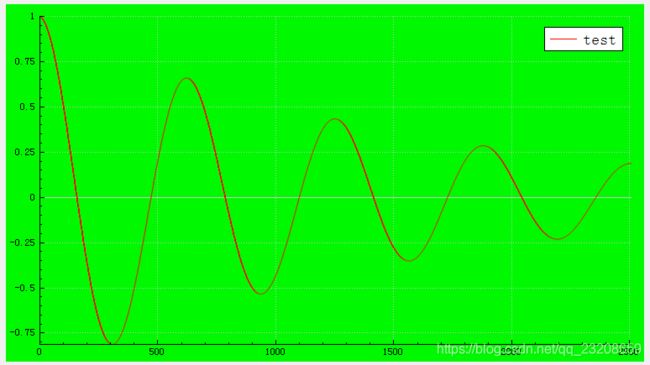
6、设置曲线名
ui->customPlot->graph(0)->setName("test");

7、设置背景色
ui->customPlot->setBackground(QBrush(QColor(0, 248, 0)));
8、设置渐变背景色
    QLinearGradient gradient(0, 0, 0, 400);
    gradient.setColorAt(0, QColor(90, 90, 90));
    gradient.setColorAt(0.38, QColor(105, 105, 105));
    gradient.setColorAt(1, QColor(70, 70, 70));
    ui->customPlot->setBackground(QBrush(gradient));

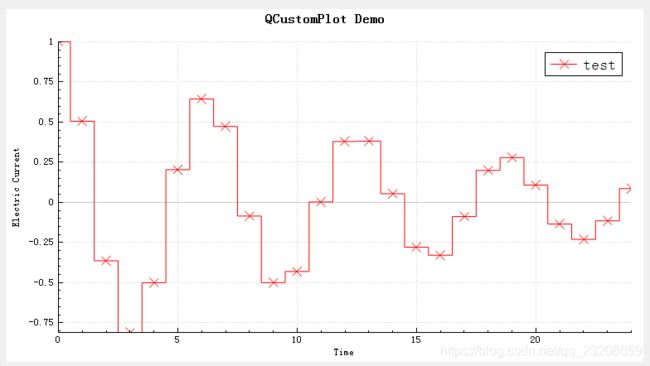
9、添加图的title
    ui->customPlot->plotLayout()->insertRow(0);
    ui->customPlot->plotLayout()->addElement(0, 0, new QCPTextElement(ui->customPlot, "QCustomPlot Demo", QFont("sans", 12, QFont::Bold)));

10、设置X轴和Y轴标签
    ui->customPlot->xAxis->setLabel("Time");
    ui->customPlot->yAxis->setLabel("Electric Current");

11、设置两点之间的连接样式
ui->customPlot->graph()->setScatterStyle(QCPScatterStyle(QCPScatterStyle::ssCross, 10));

源码中,提供了以下样式

11、设置 可以拖拽曲线
ui->customPlot->setInteraction(QCP::iRangeDrag,true);

12、设置鼠标滚轮可以缩放曲线
ui->customPlot->setInteraction(QCP::iRangeZoom,true);

13、设置X轴和Y轴的缩放因子
ui->customPlot->axisRect(0)->setRangeZoomFactor(0.2,0.2);
14、设置鼠标放于绘图区,变为手型
ui->customPlot->setCursor(QCursor(Qt::PointingHandCursor));
15、设置 可以选中X轴,或者Y轴
ui->customPlot->setInteraction( QCP::iSelectAxes,true);


16、选中X轴或者Y轴,滚动鼠标滚轮,只缩放X轴或者Y轴
   connect(ui->customPlot, &QCustomPlot::mouseWheel, this, &MainWindow::onMouseWheel);
    void MainWindow::onMouseWheel()
{
    if (ui->customPlot->xAxis->selectedParts().testFlag(QCPAxis::spAxis))
        ui->customPlot->axisRect()->setRangeZoom(ui->customPlot->xAxis->orientation());
    else if (ui->customPlot->yAxis->selectedParts().testFlag(QCPAxis::spAxis))
        ui->customPlot->axisRect()->setRangeZoom(ui->customPlot->yAxis->orientation());
    else
        ui->customPlot->axisRect()->setRangeZoom(Qt::Horizontal|Qt::Vertical);
}
17、设置曲线样式
ui->customPlot->graph()->setLineStyle(QCPGraph::lsStepCenter);
18、显示上边X轴和右边Y轴
ui->customPlot->xAxis2->setVisible(true);
    ui->customPlot->xAxis2->setTickLabels(false);
    ui->customPlot->yAxis2->setVisible(true);
    ui->customPlot->yAxis2->setTickLabels(false);

19、选中图例,对应的曲线也选中
     connect(ui->customPlot, SIGNAL(selectionChangedByUser()), this, SLOT(selectionChanged()));
     ui->customPlot->setInteractions(QCP::iSelectLegend | QCP::iSelectPlottables);
     ui->customPlot->legend->setSelectableParts(QCPLegend::spItems);

 void MainWindow::selectionChanged()
{
    // synchronize selection of graphs with selection of corresponding legend items:
    for (int i=0; i<ui->customPlot->graphCount(); ++i)
    {
        QCPGraph *graph = ui->customPlot->graph(i);
        QCPPlottableLegendItem *item = ui->customPlot->legend->itemWithPlottable(graph);

        if (item->selected())
        {
            item->setSelected(true);
            graph->setSelection(QCPDataSelection(graph->data()->dataRange()));
        }
        ui->customPlot->update();
    }
}


20、隐藏网格
ui->customPlot->xAxis->grid()->setVisible(false);
ui->customPlot->yAxis->grid()->setVisible(false);

21、设置网格颜色,子网格颜色,0线颜色
ui->customPlot->axisRect()->setBackground(QBrush(Qt::black));//背景黑色
    ui->customPlot->xAxis->grid()->setPen(QPen(QColor(180, 180, 180), 1, Qt::PenStyle::DashLine));//网格白色虚线
    ui->customPlot->yAxis->grid()->setPen(QPen(QColor(180, 180, 180), 1, Qt::PenStyle::DashLine));//网格白色虚线
    ui->customPlot->xAxis->grid()->setSubGridPen(QPen(QColor(50, 50, 50), 1, Qt::DotLine));//网格浅色点线
    ui->customPlot->yAxis->grid()->setSubGridPen(QPen(QColor(50, 50, 50), 1, Qt::DotLine));//网格浅色点线
    ui->customPlot->xAxis->grid()->setSubGridVisible(true);//显示x轴子网格线
    ui->customPlot->yAxis->grid()->setSubGridVisible(true);//显示要轴子网格线
    ui->customPlot->xAxis->grid()->setZeroLinePen(QPen(Qt::white));//x轴0线颜色白色
    ui->customPlot->yAxis->grid()->setZeroLinePen(QPen(Qt::white));//y轴0线颜色白色

22、设置X轴和Y轴的取值范围
ui->customPlot->xAxis->setRange(-500, 500);
ui->customPlot->yAxis->setRange(0, 1);

23、设置所有曲线的所有数据都能显示在plot中
ui->customPlot->graph(0)->rescaleAxes();

for (int k = 1; k < ui->customPlot->graphCount(); k++)
{
    ui->customPlot->graph(k)->rescaleAxes(true);
}
