微服务系列:服务监控 Spring Boot Actuator 和 Spring Boot Admin
- 微服务系列:服务调用 Spring Cloud 之 OpenFeign 详细入门
- 微服务系列:服务调用 Spring Cloud 之 OpenFeign 性能优化
学完上面的服务调用相关的知识后,这篇我们来学习一下服务监控。
话不多说,开始今天的学习。
基本介绍
1. 服务监控
服务监控就是监视当前系统应用状态、内存、线程、堆栈、日志等等相关信息,主要目的在服务出现问题或者快要出现问题时能够准确快速地发现以减小影响范围。
服务监控在微服务改造过程中的重要性不言而喻,没有强大的监控能力,改造成微服务架构后,就无法掌控各个不同服务的情况,在遇到调用失败时,如果不能快速发现系统的问题,对于业务来说就是一场灾难。
2. Spring Boot Actuator 服务监控接口
Actuator 是 Spring Boot 提供的用来对应用系统进行自省和监控的功能模块,借助于 Actuator 开发者可以很方便地对应用系统某些监控指标进行查看、统计等。
缺点:没有可视化界面。
3. Spring Boot Admin 服务监控管理
Spring Boot Admin 是一个针对 Spring Boot 的 Actuator 接口进行 UI 美化封装的监控工具。他可以:在列表中浏览所有被监控Spring Boot项目的基本信息,详细的 Health 信息、内存信息、JVM信息、垃圾回收信息、各种配置信息(比如数据源、缓存列表和命中率)等,还可以直接修改 logger 的 level。
Spring Boot Admin 是由 Client 端和 Server 端组成,在 Spring Boot 项目中,Spring Boot Admin作为 Server 端,其他的要被监控的应用作为 Client 端。
Actuator 使用
1. 添加依赖
<dependency>
	<groupId>org.springframework.bootgroupId>
	<artifactId>spring-boot-starter-webartifactId>
dependency>


<dependency>
	<groupId>org.springframework.bootgroupId>
	<artifactId>spring-boot-starter-actuatorartifactId>
dependency>
2. application.yml 配置
server:
  port: 9100
#自定义配置信息用于"/actuator/info"读取
info:
  name: 程序猿秃头之路
  age: 18
  phone: 123456

#通过下面的配置启用所有的监控端点,默认情况下,这些端点是禁用的
management:
  endpoints:
    web:
      exposure:
        include: "*"
3. 启动项目
启动项目后访问 http://localhost:9100/actuator
会以 JSON 的形式返回支持端点(监控点)的访问地址
{
	"_links": {
		"self": {
			"href": "http://localhost:9100/actuator",
			"templated": false
		},
		"archaius": {
			"href": "http://localhost:9100/actuator/archaius",
			"templated": false
		},
		"nacosdiscovery": {
			"href": "http://localhost:9100/actuator/nacosdiscovery",
			"templated": false
		},
		"beans": {
			"href": "http://localhost:9100/actuator/beans",
			"templated": false
		},
		"caches-cache": {
			"href": "http://localhost:9100/actuator/caches/{cache}",
			"templated": true
		},
		"caches": {
			"href": "http://localhost:9100/actuator/caches",
			"templated": false
		},
		"health": {
			"href": "http://localhost:9100/actuator/health",
			"templated": false
		},
		"health-path": {
			"href": "http://localhost:9100/actuator/health/{*path}",
			"templated": true
		},
		"info": {
			"href": "http://localhost:9100/actuator/info",
			"templated": false
		},
		"conditions": {
			"href": "http://localhost:9100/actuator/conditions",
			"templated": false
		},

                省略 ......
	}
}
这里是暴露出来了所有断点,其实默认情况下只开启了 health 和 info 端点的对外访问
#management:
#  endpoints:
#    web:
#      exposure:
#        include: "*"
{
	"_links": {
		"self": {
			"href": "http://localhost:9100/actuator",
			"templated": false
		},
		"health": {
			"href": "http://localhost:9100/actuator/health",
			"templated": false
		},
		"health-path": {
			"href": "http://localhost:9100/actuator/health/{*path}",
			"templated": true
		},
		"info": {
			"href": "http://localhost:9100/actuator/info",
			"templated": false
		}
	}
}
4. 端点信息
| 类型 | API端口 | 描述 |
|---|---|---|
| GET | /beans | 应用程序上下文bean以及之间的关系 |
| GET | /caches | 缓存信息 |
| GET | /health | 应用程序的健康指标 |
| GET | /info | 获取应用程序的信息 |
| GET | /conditions | bean状态条件详情 |
| POST | /shutdown | 关闭服务节点 |
| GET | /configprops | 描述配置属性如何注入bean |
| GET | /env | 全部环境属性信息 |
| GET | /metrics | 应用程序度量信息 |
| GET | /mappings | URL路径和控制器映射关系 |
| GET | /autoconfig | 自动配置报告,哪些条件通过,哪些条件没有通过 |
例如:
访问 http://localhost:9100/actuator/health
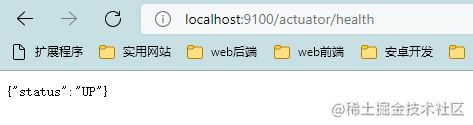
访问 http://localhost:9100/actuator/info

整合 Admin
Spring Boot Admin 是一个针对 Spring Boot 的 Actuator 接口进行 UI 美化封装的监控工具。
Spring Boot Admin 是由 Client 端和 Server 端组成,在 Spring Boot 项目中,Spring Boot Admin作为 Server 端,其他的要被监控的应用作为 Client 端。
1. 搭建 Server 端
我们新建一个 cloud-monitor 的服务
1.1、添加依赖
这里我们直接也将 Nacos 服务注册依赖也引入了进来
<dependency>
    <groupId>org.springframework.bootgroupId>
    <artifactId>spring-boot-starter-webartifactId>
dependency>

<dependency>
    <groupId>com.alibaba.cloudgroupId>
    <artifactId>spring-cloud-starter-alibaba-nacos-discoveryartifactId>
dependency>

<dependency>
    <groupId>de.codecentricgroupId>
    <artifactId>spring-boot-admin-starter-serverartifactId>
    <version>2.3.1version>
dependency>
1.2、监控启动类
@SpringBootApplication
@EnableAdminServer
public class CloudMonitorApplication {

    public static void main(String[] args) {
        SpringApplication.run(CloudMonitorApplication.class, args);
    }
}
添加了一个 @EnableAdminServer 注解
1.3、配置文件
server:
  port: 9100
spring:
  application:
    # 应用名称
    name: cloud-monitor
  cloud:
    nacos:
      discovery:
        # 服务注册地址
        server-addr: 127.0.0.1:8848

info:
  name: 程序猿秃头之路
  age: 18
  phone: 123456
1.4、启动访问
启动程序,访问地址 http://localhost:9100

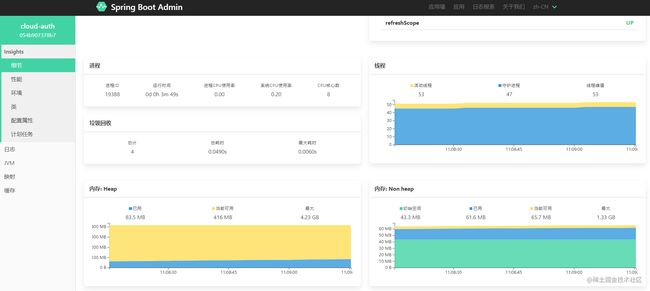
从应用墙点进去实例明细中,能看到我们可视化的 actuator 端点信息
2. 搭建 Client 端
2.1、添加依赖
<dependency>
    <groupId>org.springframework.bootgroupId>
    <artifactId>spring-boot-starter-webartifactId>
dependency>

<dependency>
    <groupId>com.alibaba.cloudgroupId>
    <artifactId>spring-cloud-starter-alibaba-nacos-discoveryartifactId>
dependency>


<dependency>
    <groupId>de.codecentricgroupId>
    <artifactId>spring-boot-admin-starter-clientartifactId>
    <version>2.3.1version>
dependency>


<dependency>
    <groupId>org.springframework.bootgroupId>
    <artifactId>spring-boot-starter-actuatorartifactId>
dependency>
一样是将 Nacos 服务注册依赖也引入了进来
2.2、配置文件
server:
  port: 9203
spring:
  application:
    # 应用名称
    name: cloud-auth
  boot:
    admin:
      client:
        url: http://localhost:9100
  cloud:
    nacos:
      discovery:
        # 服务注册地址
        server-addr: 127.0.0.1:8848

 #通过下面的配置启用所有的监控端点,默认情况下,这些端点是禁用的;
management:
  endpoints:
    web:
      exposure:
        include: "*"
  endpoint:
    health:
      show-details: always
其实我们使用了 Nacos 注册中心, admin 的服务端地址不配置也可以
spring:
  boot:
    admin:
      client:
        url: http://localhost:9100
2.3、启动访问
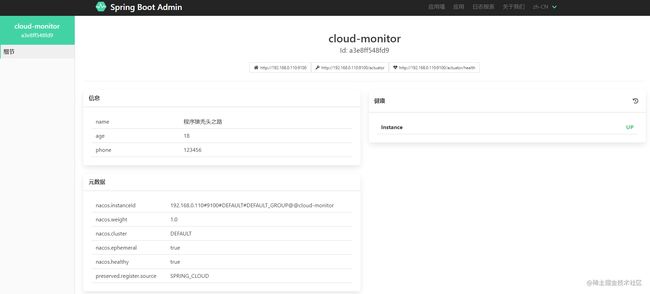
启动这个服务,刷新 http://localhost:9100,可以看到 client 端已注册到 server。

查看 client 详细信息
登录认证
在搭建成功并集成 Nacos 后,未登录用户也可访问首页,敏感信息太多,肯定得需要进行登录认证。
步骤:
1. 添加依赖
<dependency>
	<groupId>org.springframework.bootgroupId>
	<artifactId>spring-boot-starter-securityartifactId>
dependency>
2. 配置spring security权限
/**
 * 监控权限配置
 *
 * @author ezhang
 */
@Configuration
public class WebSecurityConfigurer extends WebSecurityConfigurerAdapter
{
    private final String adminContextPath;

    public WebSecurityConfigurer(AdminServerProperties adminServerProperties)
    {
        this.adminContextPath = adminServerProperties.getContextPath();
    }

    @Override
    protected void configure(HttpSecurity http) throws Exception
    {
        SavedRequestAwareAuthenticationSuccessHandler successHandler = new SavedRequestAwareAuthenticationSuccessHandler();
        successHandler.setTargetUrlParameter("redirectTo");
        successHandler.setDefaultTargetUrl(adminContextPath + "/");

        http
            .headers().frameOptions().disable()
            .and().authorizeRequests()
            .antMatchers(adminContextPath + "/assets/**"
                , adminContextPath + "/login"
                , adminContextPath + "/actuator/**"
                , adminContextPath + "/instances/**"
            ).permitAll()
            .anyRequest().authenticated()
            .and()
            .formLogin().loginPage(adminContextPath + "/login")
            .successHandler(successHandler).and()
            .logout().logoutUrl(adminContextPath + "/logout")
            .and()
            .httpBasic().and()
            .csrf()
            .disable();
    }
}
3. 在 application.yml 中配置用户 admin/123456
spring:
  security:
    user:
      name: admin
      password: 123456
  boot:
    admin:
      ui:
        title: 服务状态监控

实时日志
Spring Boot Admin提供了基于Web页面的方式实时查看服务输出的本地日志。
客户端 application.yml 中配置 logging.file.name,又或者是在 logback.xml 文件中配置
logging:
  file:
    name: logs/${spring.application.name}/info.log
注意:
如果使用了类似 `Nacos` 作为配置中心,则 `logging.file.name` 要配置在 bootstrap.yml 中
如果使用了 logback.xml,则要保证日志输出路径和 yml 中一致
<property name="log.path" value="logs/cloud-ytb" />


<appender name="file_info" class="ch.qos.logback.core.rolling.RollingFileAppender">
    <file>${log.path}/info.logfile>
appender>
然后就可以在 日志-日志文件查看实时日志
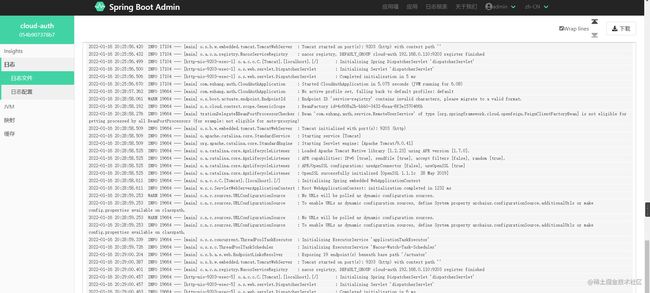
除此之外,还可以在 日志-日志配置中动态修改日志级别

PS:都看到这里了,点个赞吧,彦祖!