2022 年“泰迪杯”数据分析技能赛B 题部分解析
一、介绍
在2022 年“泰迪杯”数据分析技能赛B 题解题中,我主要负责的内容是数据探索与清洗以及客户流失因素可视化的数据处理,绘图部分由其中一个男搭档完成,文档编写由另一个女搭档完成。
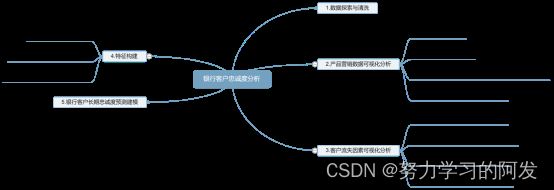
二、思路分析
三、数据探索与预处理
3.1 短期数据缺失值和重复值的处理
在本次分析赛中,我们组针对数据处理定义如下:
1、缺失值的处理 对于短期数据中的各指标的缺失值,即有数据为空值(NA值)的数据,进行删除其所在行数据。
2、重复值的处理 对于短期“user_id”列的重复值,删除重复值所在行的数据。
3、对于缺失值及重复值的处理方式,主要使用Python语言进行实现
部分重要代码如下:
import pandas as pd
short = pd.read_csv("short-customer-data.csv",sep=',')
short_na = short.isnull().sum()  #查看空值个数
print(short.info())
print(short_na[short_na>0])
short.dropna(axis=0,inplace=True) #删除含有空值所在行
short.drop_duplicates(subset='user_id',inplace=True)
short.to_excel('result1_1.xlsx')  #最后结果保存到result1_1.xlsx文件
数据处理结果展示如下所示:
| 指标 |
缺失值 |
指标 |
缺失值 |
| age |
0 |
contact |
0 |
| job |
330 |
month |
0 |
| marital |
80 |
day_of_week |
0 |
| education |
1730 |
duration |
0 |
| default |
8596 |
poutcome |
0 |
| housing |
990 |
y |
0 |
| loan |
990 |
通过上面可知,经过数据的处理,可得知短期数据的客户里面,education(教育情况)数据缺失最多,第二是default(信用违约)数据,其次是housing(住房贷款)和loan(个人贷款)。而要对这些数据进行删除,说明这几个指标对于分析短期客户购买银行产品的结果很重要。
3.2长期数据客户年龄的处理
长期数据中客户年龄“Age”列异常值的处理方式:
1、“Age”列存在数值为-1、0和“-”的异常值,删除存在该情况的行数据。
2、“Age”列存在空格和“岁”等异常字符,删除这些异常字符,保留年龄数值。
3、把处理好的数据保存到result1_2.xlsx文件中。
利用Python进行实现,重要代码如下:
import pandas as pd
short = pd.read_csv("long-customer-train.csv",sep=',')  #读取csv文件
#删除“Age”列存在空格和“岁”等异常字符,且保留年龄数值
short["Age"] = short["Age"].apply(lambda x: x.replace("\n","").replace("岁","").replace(" ",""))
#删除数值为-1、0 和“-”的异常值的行
short = short[~short['Age'].isin([-1,0,'-'])]
short.to_excel("result1_2.xlsx",index=False)  #结果保存到result1_2.xlsx文件
3.3 对短期数据对字符型数据进行特征编写
处理过程:
- 利用上文提到的已经清洗好的result1_1.xlsx数据来进行处理。
- 统计短期数据里有哪几种指标的数据是字符型数据。
- 统计每种指标的字符型数据有几种类型。
- 对每种指标的字符型数据进行特征编写。
- 将处理好的数据保存到result1_3.xlsx文件中。
根据统计,指标的数据为字符型数据的有:{job、marital、education、default、housing、loan、contact、month、day_of_week、poutcome、y}。
指标列里的字符型数据对应的特征编码如下:
| 指标 |
字符型数据 |
特征编码 |
指标 |
字符型数据 |
特征编码 |
| job |
admin |
0 |
marital |
divorced |
0 |
| retired |
1 |
single |
1 |
||
| management |
2 |
married |
2 |
||
| student |
3 |
month |
oct |
0 |
|
| unemployed |
4 |
jul |
1 |
||
| entrepreneur |
5 |
sep |
2 |
||
| services |
6 |
nov |
3 |
||
| technician |
7 |
mar |
4 |
||
| housemaid |
8 |
may |
5 |
||
| self-employed |
9 |
jun |
6 |
||
| blue-collar |
10 |
aug |
7 |
||
| education |
postgraduate |
0 |
apr |
8 |
|
| junior college |
1 |
dec |
9 |
||
| undergraduate |
2 |
day_of_week |
fri |
0 |
|
| high school |
3 |
tue |
1 |
||
| illiterate |
4 |
wed |
2 |
||
| contact |
cellular |
0 |
Thu |
3 |
|
| telephone |
1 |
mon |
4 |
||
| poutcome |
success |
0 |
default/y/ loan/housing |
no |
0 |
| failure |
1 |
yes |
1 |
||
| nonexistent |
2 |
根据上面表所显示的字符型数据对应的特征编码,利用Python进行转换,部分代码如下所示:
import pandas as pd
short = pd.read_excel("result1_1.xlsx")
short['default'].replace('no',0,inplace=True)
short['default'].replace('yes',1,inplace=True)
class_mapping = {label:idx for idx,label in enumerate(set(short['marital']))}
short['marital'] = short['marital'].map(class_mapping)
class_mapping2 = {label:idx for idx,label in enumerate(set(short['education']))}
short['education'] = short['education'].map(class_mapping2)
short.to_excel('result1_3.xlsx',index=False) #保存为result1_3.xlsx文件
3.4 对账号户龄和客户金融资产进行划分、特征编码
对于不区间的账号户龄进行特征划分,如下表所见:
| 账号户龄区间 |
客户状态 |
特征编码 |
| 【0,3】 |
新客户 |
0 |
| (3,6】 |
稳定客户 |
1 |
| >6 |
老客户 |
2 |
对于不同区间的客户金融资产进行特征划分,如下表所见:
| 客户金融资产区间 |
资产阶段 |
特征编码 |
| 【0,50000】 |
低资产 |
0 |
| (50000,90000】 |
中下资产 |
1 |
| (90000,120000】 |
中上资产 |
2 |
| >120000 |
高资产 |
3 |
利用Python进行实现,并且客户状态存于“Status”列,资产阶段存于“AssetStage”列,编码结果保存到文件“result.xlsx”中,部分代码如下:
long_train = pd.read_excel('result1_2.xlsx')
Tenure_list = []    #存储Tenure的列表
Tenure_list_cha = []    #存储Tenure特征的列表
Balance_list = []   #存储Balance的列表
Balance_list_cha = []   #存储Balance特征的列表
……
long_train.insert(loc=11,column="Status",value=Tenure_list_cha)
long_train.insert(loc=12, column="AssetStage", value=Balance_list_cha)
long_train.to_excel('result3.xlsx',index=False)
四、总结
这一次的分析赛中,自我感觉还是比较简单的,个人工作量占比大致为40%。除了上述的内容,还有很多没有放在Word(比赛作品)里面的内容,包括后面任务三的数据处理和最后的建模,我也不太想整理了,也就到这里就行了。希望上述内容能给大家提供到一定的思路。
