金融机器学习方法:决策树与随机森林
目录
1.决策树
1.1 什么是决策树?
1.2 决策树的优点与缺点
2.随机森林
2.1 什么是随机森林?
2.2 随机森林的优点与缺点
3.决策树与随机森林的联系与区别
4.案例分析
4.1 使用决策树和随机森林预测
4.2绘制ROC曲线
决策树和随机森林都是监督学习的算法,常用于分类和回归任务。本文将简要介绍这两种方法,以及它们之间的联系与区别。
1.决策树
1.1 什么是决策树?
决策树是一个树状模型,用于表示决策过程或概率事件过程。在每一个内部节点上,它都会对某个属性进行测试,根据测试结果,进一步沿着分支进行决策,直到达到叶节点,此时得到一个决策结果。
1.2 决策树的优点与缺点
优点:
- 直观易于理解,模型可以可视化。
- 需要的数据预处理较少(例如,不需要特征标准化)。
- 能够处理数字和分类数据。
缺点:
- 容易产生过拟合,特别是当树很深时。
- 对于连续属性,决策树可能不太稳定。
- 可能不总是产生最优的树。
2.随机森林
2.1 什么是随机森林?
随机森林是一个包含多个决策树的集合,用于对新的数据点进行预测。通过每棵树产生的预测结果进行“投票”或平均,来确定随机森林的最终预测。
2.2 随机森林的优点与缺点
优点:
- 降低了过拟合的风险:多个决策树的集成学习方式可以减少单个决策树的过拟合现象。
- 具有很高的准确性。
- 能够评估哪些特征对于预测最重要。
缺点:
- 训练时间可能会比单一决策树长。
- 模型更难以解释,因为它不再是一个简单的决策树。
3.决策树与随机森林的联系与区别
-
联系:随机森林是基于决策树的算法。其基本单位就是决策树。
-
区别:随机森林使用了多棵决策树,并且在构建这些决策树时会随机选择数据样本和特征,这样产生的模型差异性更大,能够更好地泛化到未知数据。而单一决策树则可能更容易受到数据中噪声的影响。
4.案例分析
我们将使用 Iris 数据集,这是机器学习中经常使用的一个数据集。它包含150个样本,每个样本有4个特征:萼片长度、萼片宽度、花瓣长度和花瓣宽度。目标是预测每个样本的种类:setosa、versicolor或virginica。
4.1 使用决策树和随机森林预测
import numpy as np

# 加载数据
iris = load_iris()
X = iris.data + np.random.normal(0, 0.5, iris.data.shape)  # 添加噪音
y = iris.target

# 划分数据集
X_train, X_test, y_train, y_test = train_test_split(X, y, test_size=0.2, random_state=42)

# 使用决策树进行训练,限制最大深度
clf_tree = DecisionTreeClassifier(max_depth=3, random_state=42)
clf_tree.fit(X_train, y_train)
y_pred_tree = clf_tree.predict(X_test)
print("决策树预测准确率:", accuracy_score(y_test, y_pred_tree))

# 使用随机森林进行训练,减少估计器的数量
clf_rf = RandomForestClassifier(n_estimators=10, random_state=42)
clf_rf.fit(X_train, y_train)
y_pred_rf = clf_rf.predict(X_test)
print("随机森林预测准确率:", accuracy_score(y_test, y_pred_rf))
预测结果;
决策树预测准确率: 0.7666666666666667
随机森林预测准确率: 0.9
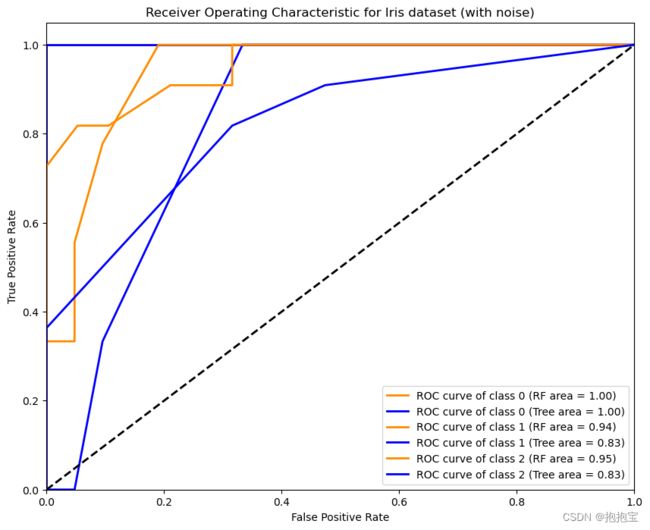
4.2绘制ROC曲线
import matplotlib.pyplot as plt
from sklearn.metrics import roc_curve, auc
from sklearn.preprocessing import label_binarize

# 为了绘制ROC曲线,我们需要将标签二值化
y_bin = label_binarize(y, classes=[0, 1, 2])
n_classes = y_bin.shape[1]

# 划分数据集
X_train, X_test, y_train_bin, y_test_bin = train_test_split(X, y_bin, test_size=0.2, random_state=42)

# 使用随机森林进行训练并预测概率
clf_rf = RandomForestClassifier(n_estimators=10, random_state=42)
clf_rf.fit(X_train, y_train_bin)
y_score_rf = clf_rf.predict_proba(X_test)

# 使用决策树进行训练并预测概率
clf_tree = DecisionTreeClassifier(max_depth=3, random_state=42)
clf_tree.fit(X_train, y_train_bin)
y_score_tree = clf_tree.predict_proba(X_test)

# 绘制ROC曲线
plt.figure(figsize=(10, 8))

for i in range(n_classes):
    fpr_rf, tpr_rf, _ = roc_curve(y_test_bin[:, i], y_score_rf[i][:, 1])
    roc_auc_rf = auc(fpr_rf, tpr_rf)

    fpr_tree, tpr_tree, _ = roc_curve(y_test_bin[:, i], y_score_tree[i][:, 1])
    roc_auc_tree = auc(fpr_tree, tpr_tree)

    plt.plot(fpr_rf, tpr_rf, color='darkorange', lw=2, label=f'ROC curve of class {i} (RF area = {roc_auc_rf:.2f})')
    plt.plot(fpr_tree, tpr_tree, color='blue', lw=2, label=f'ROC curve of class {i} (Tree area = {roc_auc_tree:.2f})')

plt.plot([0, 1], [0, 1], 'k--', lw=2)
plt.xlim([0.0, 1.0])
plt.ylim([0.0, 1.05])
plt.xlabel('False Positive Rate')
plt.ylabel('True Positive Rate')
plt.title('Receiver Operating Characteristic for Iris dataset (with noise)')
plt.legend(loc="lower right")
plt.show()
结果图:
通过上述代码,我们可以对比决策树和随机森林在鸢尾花数据集上的表现。通常,随机森林的预测准确率会优于单一决策树,因为它融合了多棵树的预测,减少了过拟合的风险。不过,特定的数据集和设置可能会导致两者的差异变大或变小。为了更准确地评估模型性能,还可以使用交叉验证等技术,并进行多次实验来获得平均结果。
