线性分类的Jupyter实践
线性分类的Jupyter实践
-
- 本期目标
- 1 鸢尾花数据集Jupyter实践
- 2 选择分类
-
- 2.1 鸢尾花 数据集的Fisher分类
- 2.2 判断准确率
- 3 可视化显示
-
- 3.1 安装seaborn库
- 3.2 数据分割
- 3.2 进行可视化
-
- 3.2.1散点图绘制
- 3.2.2直方图
- 3.2.3 箱线图
- 3.2.4 琴形图
- 3.2.5 pairplot
- 3.3 决策树分类算法判断准确率
- 4 总结
本期目标
熟悉Jupyter环境下的python编程,在Jupyter下完成一个鸢尾花数据集的线性多分类、可视化显示与测试精度实验。
1 鸢尾花数据集Jupyter实践
2 选择分类
由于要考虑到鸢尾花中哪种物理性质能够用做分类,所以需要选择一下
from sklearn import datasets
import matplotlib.pyplot as plt
import numpy as np
import math

#prepare the data
iris = datasets.load_iris()
X = iris.data
y = iris.target
names = iris.feature_names
labels = iris.target_names
y_c = np.unique(y)

"""visualize the distributions of the four different features in 1-dimensional histograms"""
fig, axes = plt.subplots(2, 2, figsize=(12, 6))
for ax, column in zip(axes.ravel(), range(X.shape[1])):
  # set bin sizes
  min_b = math.floor(np.min(X[:, column]))
  max_b = math.ceil(np.max(X[:, column]))
  bins = np.linspace(min_b, max_b, 25)

  # plotting the histograms
  for i, color in zip(y_c, ('blue', 'red', 'green')):
      ax.hist(X[y == i, column], color=color, label='class %s' % labels[i],
              bins=bins, alpha=0.5, )
  ylims = ax.get_ylim()

  # plot annotation
  l = ax.legend(loc='upper right', fancybox=True, fontsize=8)
  l.get_frame().set_alpha(0.5)
  ax.set_ylim([0, max(ylims) + 2])
  ax.set_xlabel(names[column])
  ax.set_title('Iris histogram feature %s' % str(column + 1))

  # hide axis ticks
  ax.tick_params(axis='both', which='both', bottom=False, top=False, left=False, right=False,
                 labelbottom=True, labelleft=True)

  # remove axis spines
  ax.spines['top'].set_visible(False)
  ax.spines["right"].set_visible(False)
  ax.spines["bottom"].set_visible(False)
  ax.spines["left"].set_visible(False)

axes[0][0].set_ylabel('count')
axes[1][0].set_ylabel('count')
fig.tight_layout()
plt.show()
2.1 鸢尾花 数据集的Fisher分类
使用以下代码:
np.set_printoptions(precision=4)

mean_vector = []  # 类别的平均值
for i in y_c:
    mean_vector.append(np.mean(X[y == i], axis=0))
    print('Mean Vector class %s:%s\n' % (i, mean_vector[i]))
S_W = np.zeros((X.shape[1], X.shape[1]))
for i in y_c:
    Xi = X[y == i] - mean_vector[i]
    S_W += np.mat(Xi).T * np.mat(Xi)
print('S_W:\n', S_W)

S_B = np.zeros((X.shape[1], X.shape[1]))
mu = np.mean(X, axis=0)  # 所有样本平均值
for i in y_c:
    Ni = len(X[y == i])
    S_B += Ni * np.mat(mean_vector[i] - mu).T * np.mat(mean_vector[i] - mu)
print('S_B:\n', S_B)
eigvals, eigvecs = np.linalg.eig(np.linalg.inv(S_W) * S_B)  # 求特征值,特征向量
np.testing.assert_array_almost_equal(np.mat(np.linalg.inv(S_W) * S_B) * np.mat(eigvecs[:, 0].reshape(4, 1)),
                                     eigvals[0] * np.mat(eigvecs[:, 0].reshape(4, 1)), decimal=6, err_msg='',
                                     verbose=True)
# sorting the eigenvectors by decreasing eigenvalues
eig_pairs = [(np.abs(eigvals[i]), eigvecs[:, i]) for i in range(len(eigvals))]
eig_pairs = sorted(eig_pairs, key=lambda k: k[0], reverse=True)
W = np.hstack((eig_pairs[0][1].reshape(4, 1), eig_pairs[1][1].reshape(4, 1)))
X_trans = X.dot(W)
assert X_trans.shape == (150, 2)
plt.figure(figsize=(8, 4))
plt.subplot(121)
plt.scatter(X_trans[y == 0, 0], X_trans[y == 0, 1], c='r')
plt.scatter(X_trans[y == 1, 0], X_trans[y == 1, 1], c='g')
plt.scatter(X_trans[y == 2, 0], X_trans[y == 2, 1], c='b')
plt.title('my LDA')
plt.xlabel('LD1')
plt.ylabel('LD2')
plt.legend(labels, loc='best', fancybox=True)
2.2 判断准确率
import pandas as pd
import numpy as np
import matplotlib.pyplot as plt
%matplotlib inline
df = pd.read_csv(r'http://archive.ics.uci.edu/ml/machine-learning-databases/iris/iris.data',header = None)
Iris1=df.values[0:50,0:4]
Iris2=df.values[50:100,0:4]
Iris3=df.values[100:150,0:4]
m1=np.mean(Iris1,axis=0)
m2=np.mean(Iris2,axis=0)
m3=np.mean(Iris3,axis=0)
s1=np.zeros((4,4))
s2=np.zeros((4,4))
s3=np.zeros((4,4))
for i in range(0,30,1):
    a=Iris1[i,:]-m1
    a=np.array([a])
    b=a.T
    s1=s1+np.dot(b,a)
for i in range(0,30,1):
    c=Iris2[i,:]-m2
    c=np.array([c])
    d=c.T
    s2=s2+np.dot(d,c)
    #s2=s2+np.dot((Iris2[i,:]-m2).T,(Iris2[i,:]-m2))
for i in range(0,30,1):
    a=Iris3[i,:]-m3
    a=np.array([a])
    b=a.T
    s3=s3+np.dot(b,a)
sw12=s1+s2
sw13=s1+s3
sw23=s2+s3
#投影方向
a=np.array([m1-m2])
sw12=np.array(sw12,dtype='float')
sw13=np.array(sw13,dtype='float')
sw23=np.array(sw23,dtype='float')
#判别函数以及T
#需要先将m1-m2转化成矩阵才能进行求其转置矩阵
a=m1-m2
a=np.array([a])
a=a.T
b=m1-m3
b=np.array([b])
b=b.T
c=m2-m3
c=np.array([c])
c=c.T
w12=(np.dot(np.linalg.inv(sw12),a)).T
w13=(np.dot(np.linalg.inv(sw13),b)).T
w23=(np.dot(np.linalg.inv(sw23),c)).T
#print(m1+m2) #1x4维度  invsw12 4x4维度  m1-m2 4x1维度
T12=-0.5*(np.dot(np.dot((m1+m2),np.linalg.inv(sw12)),a))
T13=-0.5*(np.dot(np.dot((m1+m3),np.linalg.inv(sw13)),b))
T23=-0.5*(np.dot(np.dot((m2+m3),np.linalg.inv(sw23)),c))
kind1=0
kind2=0
kind3=0
newiris1=[]
newiris2=[]
newiris3=[]
for i in range(30,49):
    x=Iris1[i,:]
    x=np.array([x])
    g12=np.dot(w12,x.T)+T12
    g13=np.dot(w13,x.T)+T13
    g23=np.dot(w23,x.T)+T23
    if g12>0 and g13>0:
        newiris1.extend(x)
        kind1=kind1+1
    elif g12<0 and g23>0:
        newiris2.extend(x)
    elif g13<0 and g23<0 :
        newiris3.extend(x)
#print(newiris1)
for i in range(30,49):
    x=Iris2[i,:]
    x=np.array([x])
    g12=np.dot(w12,x.T)+T12
    g13=np.dot(w13,x.T)+T13
    g23=np.dot(w23,x.T)+T23
    if g12>0 and g13>0:
        newiris1.extend(x)
    elif g12<0 and g23>0:

        newiris2.extend(x)
        kind2=kind2+1
    elif g13<0 and g23<0 :
        newiris3.extend(x)
for i in range(30,50):
    x=Iris3[i,:]
    x=np.array([x])
    g12=np.dot(w12,x.T)+T12
    g13=np.dot(w13,x.T)+T13
    g23=np.dot(w23,x.T)+T23
    if g12>0 and g13>0:
        newiris1.extend(x)
    elif g12<0 and g23>0:
        newiris2.extend(x)
    elif g13<0 and g23<0 :
        newiris3.extend(x)
        kind3=kind3+1
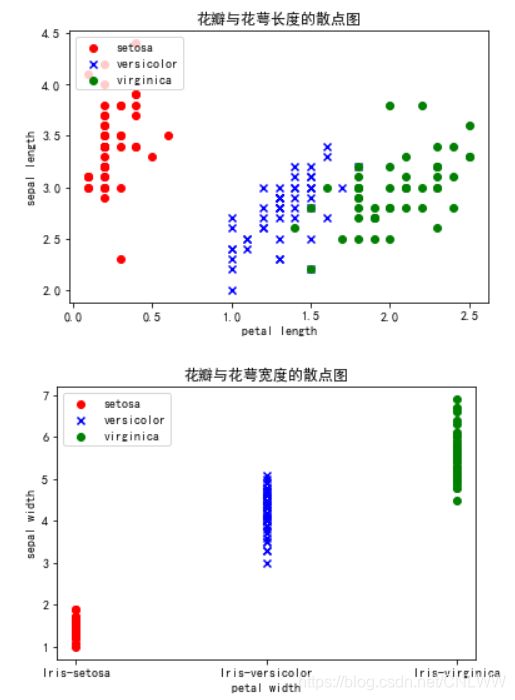
#花瓣与花萼的长度散点图
plt.scatter(df.values[:50, 3], df.values[:50, 1], color='red', marker='o', label='setosa')
plt.scatter(df.values[50:100, 3], df.values[50: 100, 1], color='blue', marker='x', label='versicolor')
plt.scatter(df.values[100:150, 3], df.values[100: 150, 1], color='green', label='virginica')
plt.xlabel('petal length')
plt.ylabel('sepal length')
plt.title("花瓣与花萼长度的散点图")
plt.rcParams['font.sans-serif']=['SimHei'] #显示中文标签
plt.rcParams['axes.unicode_minus']=False
plt.legend(loc='upper left')
plt.show()

#花瓣与花萼的宽度度散点图
plt.scatter(df.values[:50, 4], df.values[:50, 2], color='red', marker='o', label='setosa')
plt.scatter(df.values[50:100, 4], df.values[50: 100, 2], color='blue', marker='x', label='versicolor')
plt.scatter(df.values[100:150, 4], df.values[100: 150, 2], color='green', label='virginica')
plt.xlabel('petal width')
plt.ylabel('sepal width')
plt.title("花瓣与花萼宽度的散点图")
plt.legend(loc='upper left')
plt.show()

correct=(kind1+kind2+kind3)/60
print("样本类内离散度矩阵S1:",s1,'\n')
print("样本类内离散度矩阵S2:",s2,'\n')
print("样本类内离散度矩阵S3:",s3,'\n')
print('-----------------------------------------------------------------------------------------------')
print("总体类内离散度矩阵Sw12:",sw12,'\n')
print("总体类内离散度矩阵Sw13:",sw13,'\n')
print("总体类内离散度矩阵Sw23:",sw23,'\n')
print('-----------------------------------------------------------------------------------------------')
print('判断出来的综合正确率:',correct*100,'%')
3 可视化显示
3.1 安装seaborn库
通过win+r打开命令框,安装seaborn库
pip install seaborn

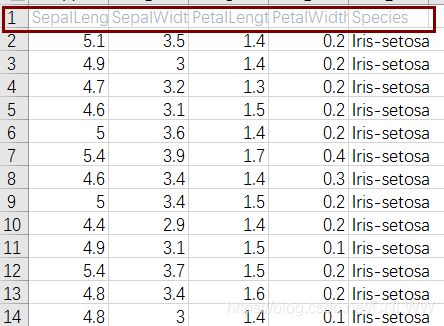
提前准备好的lris.csv数据集

打开lris.scv,在数据的第一行分别插入
SepalLengthCm,SepalWidthCm,PetalLengthCm,PetalWidthCm,Species
3.2 数据分割
有了数据集就不用像上面一样需要打地址了,首先读取数据,拿到鸢尾花数据后进行数据清洗,去掉Species特征中的‘Iris-’字符:
import numpy as np
import pandas as pd
import seaborn as sns
import matplotlib.pyplot as plt
df_Iris = pd.read_csv('Iris.csv')
#对数据进行分割
df_Iris['Species']= df_Iris.Species.apply(lambda x: x.split('-')[1])
df_Iris.Species.unique()
3.2 进行可视化
3.2.1散点图绘制
进行可视化,分析数据之间的关系和数据的分布
使用replot来绘制散点图,来表示数据
#sns初始化
sns.set()
#设置散点图x轴与y轴以及data参数
sns.relplot(x='SepalLengthCm', y='SepalWidthCm', data = df_Iris)
plt.title('SepalLengthCm and SepalWidthCm data analysize')
#hue表示按照Species对数据进行分类, 而style表示每个类别的标签系列格式不一致.
sns.relplot(x='SepalLengthCm', y='SepalWidthCm', hue='Species', style='Species', data=df_Iris )
plt.title('SepalLengthCm and SepalWidthCm data by Species')
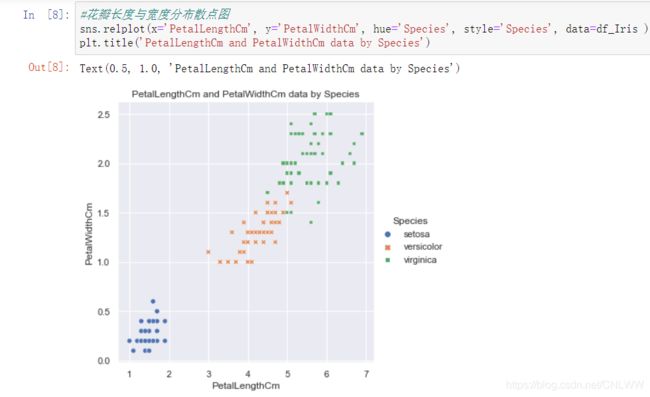
#花瓣长度与宽度分布散点图
sns.relplot(x='PetalLengthCm', y='PetalWidthCm', hue='Species', style='Species', data=df_Iris )
plt.title('PetalLengthCm and PetalWidthCm data by Species')
#花萼与花瓣长度分布散点图
sns.relplot(x='SepalLengthCm', y='PetalLengthCm', hue='Species', style='Species', data=df_Iris )
plt.title('SepalLengthCm and PetalLengthCm data by Species')
#花萼与花瓣宽度分布散点图
sns.relplot(x='SepalWidthCm', y='PetalWidthCm', hue='Species', style='Species', data=df_Iris )
plt.title('SepalWidthCm and PetalWidthCm data by Species')
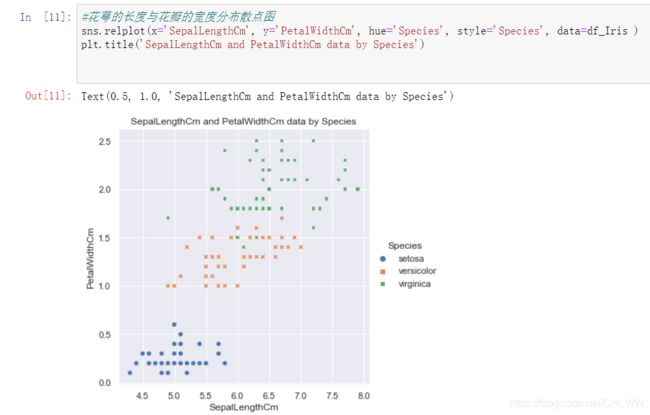
#花萼的长度与花瓣的宽度分布散点图
sns.relplot(x='SepalLengthCm', y='PetalWidthCm', hue='Species', style='Species', data=df_Iris )
plt.title('SepalLengthCm and PetalWidthCm data by Species')
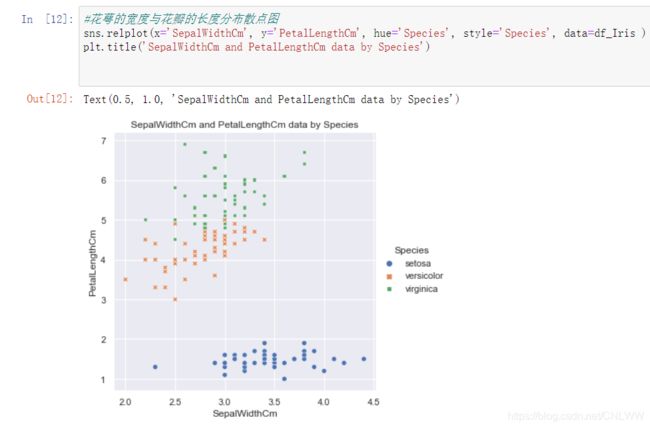
#花萼的宽度与花瓣的长度分布散点图
sns.relplot(x='SepalWidthCm', y='PetalLengthCm', hue='Species', style='Species', data=df_Iris )
plt.title('SepalWidthCm and PetalLengthCm data by Species')
3.2.2直方图
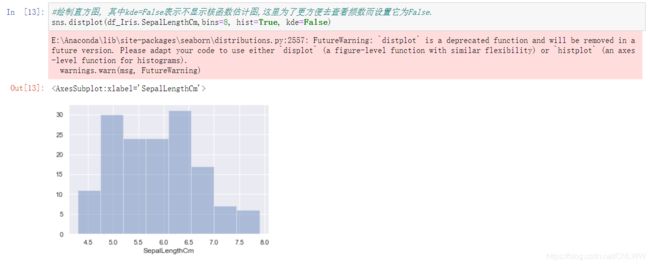
直方图正正方方的,非常适合观察频数
#绘制直方图, 其中kde=False表示不显示核函数估计图,这里为了更方便去查看频数而设置它为False.
sns.distplot(df_Iris.SepalLengthCm,bins=8, hist=True, kde=False)
sns.distplot(df_Iris.SepalWidthCm,bins=13, hist=True, kde=False)
sns.distplot(df_Iris.PetalLengthCm, bins=5, hist=True, kde=False)
sns.distplot(df_Iris.PetalWidthCm, bins=5, hist=True, kde=False)
3.2.3 箱线图
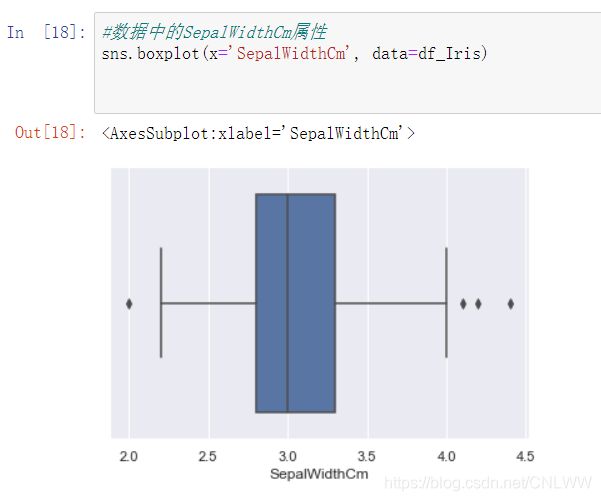
箱形图(Box-plot)又称为盒须图、盒式图或箱线图,是一种用作显示一组数据分散情况资料的统计图。因形状如箱子而得名。
使用箱线图可以清楚看到最大最小值
#数据中的SepalLengthCm属性
sns.boxplot(x='SepalLengthCm', data=df_Iris)
#数据中的SepalWidthCm属性
sns.boxplot(x='SepalWidthCm', data=df_Iris)
#对于每个属性的data创建一个新的DataFrame
Iris1 = pd.DataFrame({"Id": np.arange(1,151), 'Attribute': 'SepalLengthCm', 'Data':df_Iris.SepalLengthCm, 'Species':df_Iris.Species})
Iris2 = pd.DataFrame({"Id": np.arange(151,301), 'Attribute': 'SepalWidthCm', 'Data':df_Iris.SepalWidthCm, 'Species':df_Iris.Species})
Iris3 = pd.DataFrame({"Id": np.arange(301,451), 'Attribute': 'PetalLengthCm', 'Data':df_Iris.PetalLengthCm, 'Species':df_Iris.Species})
Iris4 = pd.DataFrame({"Id": np.arange(451,601), 'Attribute': 'PetalWidthCm', 'Data':df_Iris.PetalWidthCm, 'Species':df_Iris.Species})
#将四个DataFrame合并为一个.
Iris = pd.concat([Iris1, Iris2, Iris3, Iris4])
#绘制箱线图
sns.boxplot(x='Attribute', y='Data', data=Iris)
sns.boxplot(x='Attribute', y='Data',hue='Species', data=Iris)
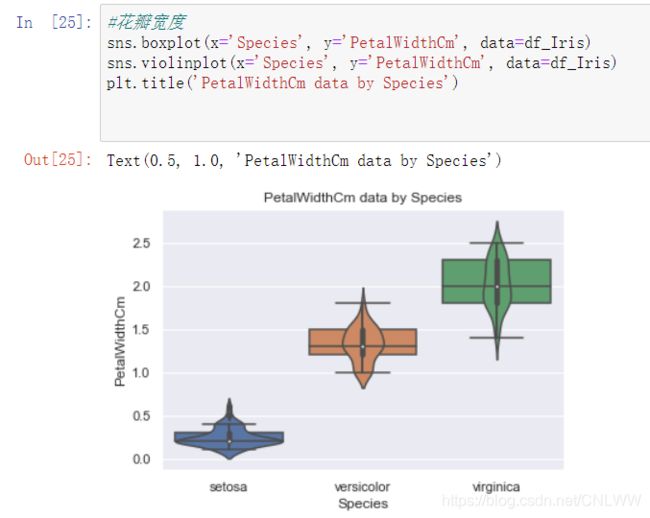
3.2.4 琴形图
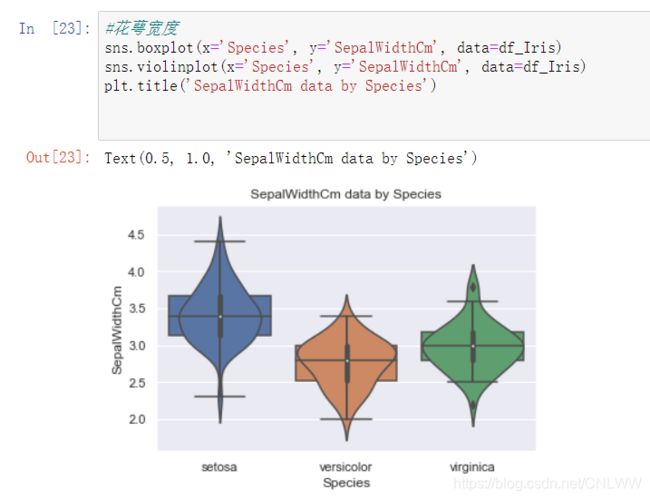
琴形图能够展示相应数据下其他数据的分布与密度
sns.violinplot(x='Attribute', y='Data', hue='Species', data=Iris )
#花萼长度
sns.boxplot(x='Species', y='SepalLengthCm', data=df_Iris)
sns.violinplot(x='Species', y='SepalLengthCm', data=df_Iris)
plt.title('SepalLengthCm data by Species')
#花萼宽度
sns.boxplot(x='Species', y='SepalWidthCm', data=df_Iris)
sns.violinplot(x='Species', y='SepalWidthCm', data=df_Iris)
plt.title('SepalWidthCm data by Species')
#花瓣长度
sns.boxplot(x='Species', y='PetalLengthCm', data=df_Iris)
sns.violinplot(x='Species', y='PetalLengthCm', data=df_Iris)
plt.title('PetalLengthCm data by Species')
#花瓣宽度
sns.boxplot(x='Species', y='PetalWidthCm', data=df_Iris)
sns.violinplot(x='Species', y='PetalWidthCm', data=df_Iris)
plt.title('PetalWidthCm data by Species')
3.2.5 pairplot
pairplot中pair是成对的意思,pairplot主要展现的是变量两两之间的关系(线性或非线性,有无较为明显的相关关系)
sns.pairplot(df_Iris, hue='Species')
plt.savefig('pairplot.png')
plt.show()
3.3 决策树分类算法判断准确率
测一下准确率
from sklearn.model_selection import train_test_split
from sklearn.tree import DecisionTreeClassifier

X = df_Iris[['SepalLengthCm','SepalWidthCm','PetalLengthCm','PetalWidthCm']]
y = df_Iris['Species']
#将数据按照8:2的比例随机分为训练集, 测试集
X_train, X_test, y_train, y_test = train_test_split(X, y, test_size=0.2)
#初始化决策树模型
dt = DecisionTreeClassifier()
#训练模型
dt.fit(X_train, y_train)
#用测试集评估模型的好坏
dt.score(X_test, y_test)
准确率有90%,还是比较能信任的

但又测一次又会变一次准确度,变成了96.7%

每一次都会变,最低86%,最高100%,不知道为啥…
4 总结
本次实验,我将鸢尾花的数据集拿来使用,并分别使用了散点图,直方图,箱型图,琴形图进行绘制,学习到了很多的东西,希望下次学习能够学到更多东西.


