Vue中使用echarts实现水球图

效果:
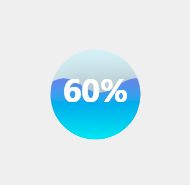
Vue中使用echarts实现水球图_第1张图片
在线调试网址:https://gallery.echartsjs.com/editor.html?c=xry0tUfcBe

echarts使用说明请查看:Vue中使用echarts实现常用图表总结

控制台输入安装echarts以及水球图
npm install echarts --save
npm install echarts-liquidfill --save
vue main.js中注册
import echarts from 'echarts'  //引入echarts
import 'echarts-liquidfill'
组件中使用
<template>
	<div class="hygrometer" ref="hygrometer"></div>
</template>
let hygrometer = this.$echarts.init(this.$refs.hygrometer)
option = {
            series: [{
                type: 'liquidFill',
                radius: '100px',
                data: [0.6],
                label: {
                    normal: {
                        color: '#fff',
                        insideColor: 'transparent',
                        textStyle: {
                            fontSize: 30,
                            fontWeight: 'bold',
                        }
                    }
                },
                color: [{
                    type: 'linear',
                    x: 0,
                    y: 1,
                    x2: 0,
                    y2: 0,
                    colorStops: [{
                        offset: 1,
                        color: ['#6a7feb'], // 0% 处的颜色
                    }, {
                        offset: 0,
                        color: ['#27e5f1'], // 100% 处的颜色
                    }],
                    global: false // 缺省为 false
                }],
                outline: {
                    show: true,
                    borderDistance: 5,
                    itemStyle: {
                        borderColor: 'rgba(67,209,100,1)',
                        borderWidth: 0
                    }
                }
            }]
        }
        console.log('option', option)
        hygrometer.setOption(option)
        

数据动态显示只需要调用后台接口,改变data的值即可
如果想做成水滴形状可以增加shape属性,利用svg的path路径,如

let option = {
            series: [{
                type: 'liquidFill',
                radius: '100px',
                data: [0.6],
                shape: 'path://M 100 120 a 140 140 0 1 0 198 0 c -26 -26 -44 -48 -44 -90 c -42 28 -128 64 -154 90"',
                label: {
                    normal: {
                        color: '#fff',
                        insideColor: 'transparent',
                        textStyle: {
                            fontSize: 30,
                            fontWeight: 'bold',
                        }
                    }
                },
                color: [{
                    type: 'linear',
                    x: 0,
                    y: 1,
                    x2: 0,
                    y2: 0,
                    colorStops: [{
                        offset: 1,
                        color: ['#6a7feb'], // 0% 处的颜色
                    }, {
                        offset: 0,
                        color: ['#27e5f1'], // 100% 处的颜色
                    }],
                    global: false // 缺省为 false
                }],
                outline: {
                    show: true,
                    borderDistance: 5,
                    itemStyle: {
                        borderColor: 'rgba(67,209,100,1)',
                        borderWidth: 0
                    }
                }
            }]
        }

Vue中使用echarts实现水球图_第2张图片

如果大家想一起交流学习,共同进步,欢迎搜索公众号“是日前端”,输入关键词如:前端基础,获取资料,资料刚开始整理,目前还在完善中,点击交流群按钮进交流群,群里仅限技术交流、面试交流等,需要其它相关资料可以群里说,后续交流群人数增多会考虑特色内容,再次感谢大家的支持~

你可能感兴趣的:(#项目应用中总结,前端,#Vue,vue,javascript,js,前端,echarts)