Echarts实现进度条效果

Echarts实现进度条效果

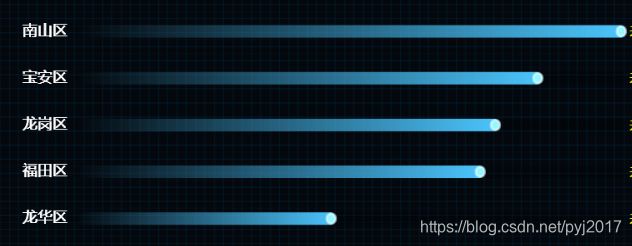
实现效果如图:
Echarts实现进度条效果_第1张图片

option = {
grid: {
                    containLabel: true,
                    left: 0,
                    right: 0,
                    top: 0,
                    bottom: 0,
                },
                xAxis: {
                    type: 'value',
                    splitLine: {
                        show: false
                    }, //坐标轴在 grid 区域中的分隔线
                    axisLabel: {
                        show: false
                    }, //坐标轴刻度标签
                    axisTick: {
                        show: false
                    }, //坐标轴刻度
                    axisLine: {
                        show: false
                    }, //坐标轴轴线
                },
                yAxis: {
                    type: 'category',
                    axisTick: {
                        show: false
                    },
                    axisLine: {
                        show: false
                    },
                    axisLabel: {
                        show: false
                    },
                },
                series: [{
                    type: "bar",
                    barWidth: 16,
                    barMinHeight: 20,
                    zlevel: 1,
                    data: [40],
                    itemStyle: {
                        normal: {
                            barBorderRadius: [0, 10, 10, 0],
                            color: new echarts.graphic.LinearGradient(1, 0, 0, 0, [{
                                offset: 0.2,
                                color: '#359eff'
                            },
                                {
                                    offset: 1,
                                    color: "#35dbff"
                                }
                            ])
                        }
                    },

                }, {
                    type: "bar",
                    barGap: '-100%',
                    barWidth: 16,
                    data: [100],
                    itemStyle: {
                        normal: {
                            barBorderRadius: [0, 16, 16, 0],
                            color: new echarts.graphic.LinearGradient(
                                0, 0, 1, 0, [{
                                    offset: 0,
                                    color: 'rgba(75, 197, 253, 0)'
                                },
                                {
                                    offset: 1,
                                    color: 'rgba(75, 197, 253, 1)'
                                }
                            ]
                            ),
                            label: {
                                show: true,
                                position: 'insideRight',
                                formatter: '   ',
                                backgroundColor: '#94f6ff',
                                distance: 0,
                                borderColor: 'rgba(255, 255, 255, 0.5)',
                                borderWidth: 3,
                                borderRadius: 10,
                                color: '#94f6ff'
                            }
                        }
                    },

                }
                ],
};
你可能感兴趣的:(js,echarts,js,数据可视化)