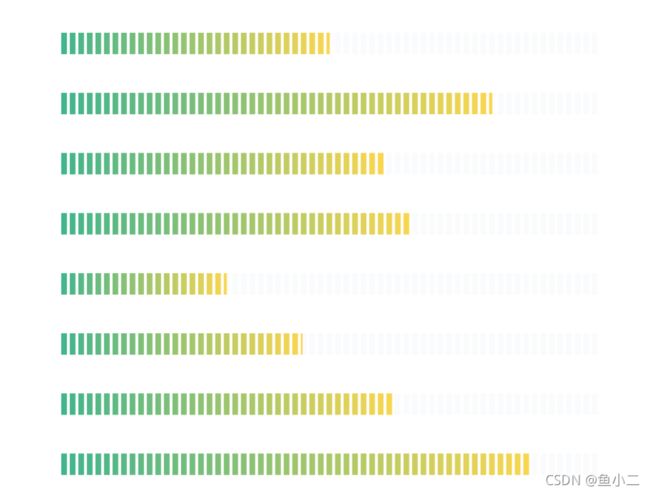
echarts渐变进度条
展示情况如下图

相关代码
var data = ['数据一','数据二',"数据三","数据四","数据五","六","七","八"]
let value = [0.50,0.80,0.60,0.65,0.31,0.45,0.62,0.87]
let arr = (new Array(value.length)).fill(1)
option = {
    backgroundColor: '#fff',
			grid: {
				top: '8%',
				left: '15%',
				right: '17.3%',
				bottom: '10%'
			},
			tooltip: {show: false},
			xAxis: {
				type: 'value',
				min: 0,
				max: 1,
				axisLine: {show: false},
				splitLine: {show: false},
				axisLabel: {show: false},
				axisTick: {show: false}
			},
			yAxis: {
				//show: false,
				type: 'category',
				inverse: true,
				splitLine: {show: false,},
				axisLine: {show: false},
				axisLabel: {
					show: true,
					interval: 0,
					margin: 10,
					textStyle: {
						color: '#ffffff',
						fontSize: 16,
						fontWeight: 'bold',
					}
				},
				axisTick: {show: false},
				data:data
			},
			series: [
				{
					//渐变数据内容
					type: 'bar',
					barWidth: 30,
					animationDuration:2000,
					itemStyle: {
						normal: {
							borderWidth: 0,
							color: {
								type: 'linear',
								x: 0,
								y: 0,
								x2: 1,
								y2: 0,
								colorStops: [{
									offset: 0,
									color: '#15a675'
								}, {
									offset: 1,
									color: '#ffd127'
								}]
							}
						},
					},
					label: {
						show: false,
					},
					data: value,
					z: 0
				},
				{
					//背景柱状图
					type: 'bar',
					barWidth: 30,
					barGap: '-100%',
					animation: false,
					itemStyle: {
						normal: {
							borderWidth: 0,
							color: '#e4ebf1',
							opacity: 0.2,
							borderWidth: 0
						},
					},
					data: arr,
					z: 0
				},

				{
					//辅助分割图形
					type: 'pictorialBar',
					barWidth: 32,
					symbol: 'rect',
					// symbolRotate:"-20",
					symbolMargin: '100%',   //控制分割图形的大小
					symbolSize: [4, '100%'],
					symbolOffset: [-0.5, 0],
					symbolRepeat: true,
					animation: false,
					itemStyle: {
						normal: {
							color: '#fff',
							borderWidth: 0
						},
					},
					data: arr,
					z: 1
				}
			]
		};
