ELK 日志分析实践
一 ELK
1 ELK 概述
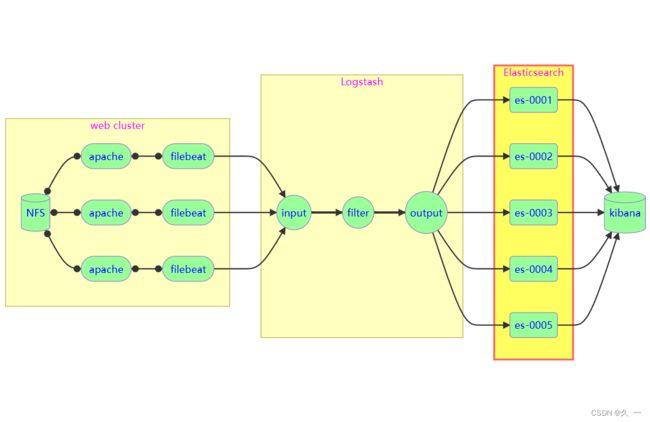
ELK是一整套解决方案,是三个软件产品的首字母缩写,很多公司都在使用,如:Sina、携程、华为、美团等
Elasticsearch:负责日志检索和储存
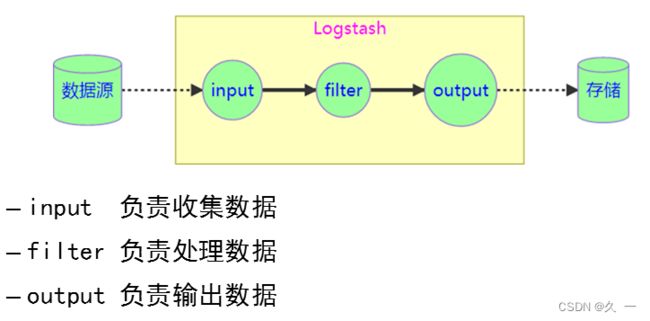
Logstash:负责日志的收集和分析、处理
Kibana:负责日志的可视化
2 项目架构图
二 Elasticsearch
1 Elasticsearch概述
elasticsearch 是一个基于 Lucene 的搜索服务器。它提供了一个分布式多用户能力的全文搜索引擎,基于 RESTfulAPI的Web接口
elasticsearch 的一大优势是拥有集群协调子系统。集群协调子系统可以从只有几个节点的小集群无缝扩展到拥有数百个节点的大集群
2 主要特点
- 实时分析,文档导向,分布式实时文件存储
- 高可用性,易扩展,支持集群 (Cluster) 、分片和复制(Shards 和 Replicas)
- 接口友好,支持JSON
- 没有典型意义的事务
- 是一种面向文档的数据库
3 名词解释
| Node | 装有一个ES服务器的节点 |
| Cluster | 有多个Node组成的集群 |
| Shards | 索引的分片,每一个分片就是一个Shard |
| Replicas | 索引的拷贝 |
| Index | 拥有相似特征的文档的集合 |
| Type | 一个索引中可以定义一种或多种类型 |
| Document | 一个可被搜索的基础信息单元 |
| Filed | 是ES的最小单位,相当于数据的某一列 |
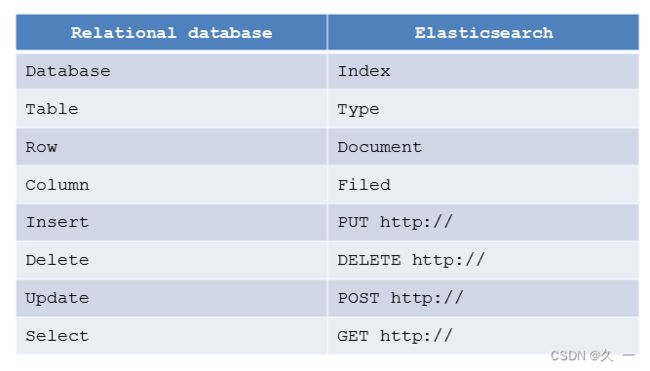
4 Elasticsearch 与关系型数据库对比
5 部署Elasticsearch集群
(1)准备工作
-
更新 yum车软件仓库
# 添加 ELK 软件包到自定义 Yum 仓库
[root@ecs-proxy s4]# rsync -av elk/ /var/localrepo/elk/
[root@ecs-proxy s4]# createrepo --update /var/localrepo-
配置服务主机
| 主机 | IP地址 | 配置 |
|---|---|---|
| es-0001 | 192.168.1.21 | 最低配置2核4G |
| es-0002 | 192.168.1.22 | 最低配置2核4G |
| es-0003 | 192.168.1.23 | 最低配置2核4G |
| es-0004 | 192.168.1.24 | 最低配置2核4G |
| es-0005 | 192.168.1.25 | 最低配置2核4G |
(2)集群安装
-
部署 es-0001
[root@es-0001 ~]# vim /etc/hosts
192.168.1.21    es-0001
192.168.1.22    es-0002
192.168.1.23    es-0003
192.168.1.24    es-0004
192.168.1.25    es-0005
[root@es-0001 ~]# dnf install -y elasticsearch
[root@es-0001 ~]# vim /etc/elasticsearch/elasticsearch.yml
17:  cluster.name: my-es    # 集群名称
23:  node.name: es-0001     # 集群主机名
56:  network.host: 0.0.0.0  # 集群广播成员
70:  discovery.seed_hosts: ["es-0001", "es-0002", "es-0003"]  # 集群创始人成员
74:  cluster.initial_master_nodes: ["es-0001", "es-0002", "es-0003"]
[root@es-0001 ~]# systemctl enable --now elasticsearch
# 服务启动成功
[root@es-0001 ~]# curl http://127.0.0.1:9200
{
  "name" : "es-0001",
  "cluster_name" : "my-es",
  "cluster_uuid" : "_na_",
  "version" : {
    "number" : "7.17.8",
    "build_flavor" : "default",
    "build_type" : "rpm",
    "build_hash" : "120eabe1c8a0cb2ae87cffc109a5b65d213e9df1",
    "build_date" : "2022-12-02T17:33:09.727072865Z",
    "build_snapshot" : false,
    "lucene_version" : "8.11.1",
    "minimum_wire_compatibility_version" : "6.8.0",
    "minimum_index_compatibility_version" : "6.0.0-beta1"
  },
  "tagline" : "You Know, for Search"
}-
部署 es-0002
# 验证集群状态失败
[root@es-0002 ~]# curl http://es-0001:9200/_cat/nodes?pretty
{
  "error" : {
    "root_cause" : [
      {
        "type" : "master_not_discovered_exception",
        "reason" : null
      }
    ],
    "type" : "master_not_discovered_exception",
    "reason" : null
  },
  "status" : 503
}
# 部署服务
[root@es-0002 ~]# vim /etc/hosts
192.168.1.21    es-0001
192.168.1.22    es-0002
192.168.1.23    es-0003
192.168.1.24    es-0004
192.168.1.25    es-0005
[root@es-0002 ~]# dnf install -y elasticsearch
[root@es-0002 ~]# vim /etc/elasticsearch/elasticsearch.yml
17:  cluster.name: my-es
23:  node.name: es-0002
56:  network.host: 0.0.0.0
70:  discovery.seed_hosts: ["es-0001", "es-0002", "es-0003"]
74:  cluster.initial_master_nodes: ["es-0001", "es-0002", "es-0003"]
[root@es-0002 ~]# systemctl enable --now elasticsearch
# 验证集群状态
[root@es-0002 ~]# curl http://es-0001:9200/_cat/nodes?pretty
192.168.1.21 16 89  2 0.15 0.06 0.04 cdfhilmrstw * es-0001
192.168.1.22  6 88 61 1.00 0.23 0.08 cdfhilmrstw - es-0002
(3)集群扩容
集群结点数量较多时,一般使用 Ansible 批量部署
在所有 es 主机安装 Elasticsearch
[root@ecs-proxy ~]# mkdir es
[root@ecs-proxy ~]# cd es
[root@ecs-proxy es]# vim ansible.cfg
[defaults]
inventory         = hostlist
host_key_checking = False
[root@ecs-proxy es]# vim hostlist
[es]
192.168.1.[21:25]
[root@ecs-proxy es]# rsync -av 192.168.1.21:/etc/elasticsearch/elasticsearch.yml elasticsearch.j2
[root@ecs-proxy es]# vim elasticsearch.j2
23:  node.name: {{ ansible_hostname }}
[root@ecs-proxy es]# vim es_install.yaml
---
- name: Elasticsearch 集群安装
  hosts: es
  tasks:
  - name: 设置 /etc/hosts
    copy:
      dest: /etc/hosts
      owner: root
      group: root
      mode: '0644'
      content: |
        ::1     localhost localhost.localdomain localhost6 localhost6.localdomain6
        127.0.0.1   localhost localhost.localdomain localhost4 localhost4.localdomain4
        {% for i in groups.es %}
        {{ hostvars[i].ansible_eth0.ipv4.address }} {{ hostvars[i].ansible_hostname }}
        {% endfor %}
  - name: 安装 ES 服务
    dnf:
      name: elasticsearch
      state: latest
      update_cache: yes
  - name: 拷贝配置文件
    template:
      src: elasticsearch.j2
      dest: /etc/elasticsearch/elasticsearch.yml
      owner: root
      group: elasticsearch
      mode: '0660'
  - name: 配置 ES 服务
    service:
      name: elasticsearch
      state: started
      enabled: yes

[root@ecs-proxy es]# ansible-playbook es_install.yaml
[root@ecs-proxy es]# curl http://192.168.1.21:9200/_cat/nodes?pretty
192.168.1.21 32 88 0 0.04 0.01 0.00 cdfhilmrstw * es-0001
192.168.1.22 16 87 0 0.13 0.04 0.01 cdfhilmrstw - es-0002
192.168.1.23  6 86 1 0.64 0.21 0.07 cdfhilmrstw - es-0003
192.168.1.24 18 86 0 0.44 0.13 0.05 cdfhilmrstw - es-0004
192.168.1.25  6 86 1 0.67 0.21 0.07 cdfhilmrstw - es-0005
(4)集群管理
-
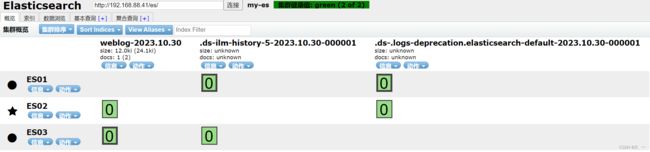
head插件
它展现ES集群的拓扑结构,并且可以通过它来进行索引(Index)和节点(Node) 级别的操作
它提供一组针对集群的查询API,并将结果以ison和表格形式返回
它提供一些快捷菜单,用以展现集群的各种状态
-
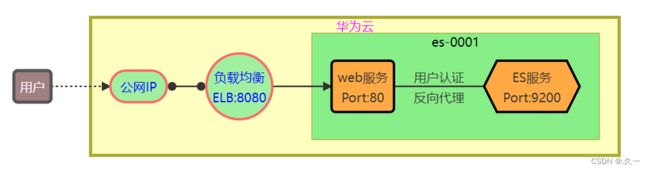
Head插件原理图
Head插件的本质就是一组网页
在es-0001上安装 web 服务,并部署插件页面
通过 ELB映射8080端口,发布 web 服务
- 部署插件页面
# 拷贝插件 public/head.tar.gz 到 es-0001 主机
[root@ecs-proxy s4]# rsync -av public/head.tar.gz 192.168.1.21:./
#-------------------------------------------------
# 在 es-0001 上安装 web 服务,并部署插件
[root@es-0001 ~]# dnf install -y nginx
[root@es-0001 ~]# systemctl enable --now nginx
[root@es-0001 ~]# tar zxf head.tar.gz -C /usr/share/nginx/html/
通过 ELB 的 8080 端口,发布服务到互联网
- 认证和代理
[root@es-0001 ~]# vim /etc/nginx/default.d/esproxy.conf
location ~* ^/es/(.*)$ {
    proxy_pass http://127.0.0.1:9200/$1;
    auth_basic "Elasticsearch admin";
    auth_basic_user_file /etc/nginx/auth-user;
}
[root@es-0001 ~]# dnf install -y httpd-tools
[root@es-0001 ~]# htpasswd -cm /etc/nginx/auth-user admin
New password:
Re-type new password:
Adding password for user admin
[root@es-0001 ~]# systemctl reload nginx
通过 head 插件管理 elasticsearch 集群
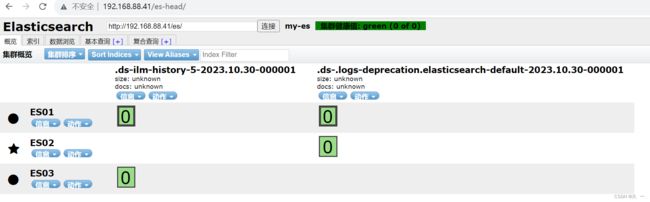
6 API原语管理
拓展提高知识
Elasticsearch 提供基于http协议的管理方式 (API)
http 请求由三部分组成
— 分别是:请求行、消息报头、请求正文
— 请求行: Method Request-URI HTTP-Version
http 请求方法
— 常用方法 GET,POST,HEAD
— 其他方法OPTIONS,PUT,DELETE,TRACE 和CONNECT
与Elasticsearch交互的数据需使用json格式
HEAD:Content-Type: application/json
Elasticsearch使用的请求方法
| PUT | 增 |
| DELETE | 删 |
| POST | 改 |
| GET | 查 |
在 linux 中 curl 是一个利用URL规则在命令行下工作的文件传输工具,可以说是一款很强大的http命令行工具。它支持多种请求模式,自定义请求头等强大功能
使用格式:curl -X “请求方法” -H “请求头” http://请求地址
_cat 关键字用来查询集群状态,节点信息等
- 显示详细信息(?v),5显示帮助信息(?help)
- json 使用易读的调试格式显示 (?pretty)
- 例如:查询集群中的 master 是谁
(1)集群状态查询
# 查询支持的关键字
[root@es-0001 ~]# curl -XGET http://127.0.0.1:9200/_cat/
# 查具体的信息
[root@es-0001 ~]# curl -XGET http://127.0.0.1:9200/_cat/master
# 显示详细信息 ?v
[root@es-0001 ~]# curl -XGET http://127.0.0.1:9200/_cat/master?v
# 显示帮助信息 ?help
[root@es-0001 ~]# curl -XGET http://127.0.0.1:9200/_cat/master?help
# 显示易读格式 ?pretty
[root@es-0001 ~]# curl -XGET http://127.0.0.1:9200/_cat/master?pretty
(2)创建索引
- 指定索引的名称,指定分片数量,指定副本数量
# 设置默认分片副本数量
[root@es-0001 ~]# curl -XPUT -H 'Content-Type: application/json' \
    http://127.0.0.1:9200/_template/index_defaults -d '{
      "template": "*",
      "settings": {
        "number_of_shards": 5,
        "number_of_replicas": 1
      }
    }'
{"acknowledged":true}

# 创建 tedu 索引
[root@es-0001 ~]# curl -XPUT http://127.0.0.1:9200/tedu?pretty
{
  "acknowledged" : true,
  "shards_acknowledged" : true,
  "index" : "tedu"
}
(3)增加数据
[root@es-0001 ~]# curl -XPUT -H "Content-Type: application/json" \
    http://127.0.0.1:9200/tedu/teacher/1?pretty -d '{
        "职业": "诗人","名字": "李白","称号": "诗仙","年代": "唐"
    }'
(4)查询数据
[root@es-0001 ~]# curl -XGET http://127.0.0.1:9200/tedu/teacher/_search?pretty
[root@es-0001 ~]# curl -XGET http://127.0.0.1:9200/tedu/teacher/1?pretty
(5)修改数据
[root@es-0001 ~]# curl -XPOST -H "Content-Type: application/json" \
    http://127.0.0.1:9200/tedu/teacher/1/_update -d '{
      "doc": {"年代":"公元701"}
    }'
(6)删除数据
# 删除一条
[root@es-0001 ~]# curl -XDELETE http://127.0.0.1:9200/tedu/teacher/1
# 删除索引
[root@es-0001 ~]# curl -XDELETE http://127.0.0.1:9200/tedu
三 Logstash
1 Logstash概述
是一个数据采集、加工处理以及传输的工具
2 Logstash特点
- 所有类型的数据集中处理
- 不同模式和格式数据的正常化
- 自定义日志格式的迅速扩展
- 为自定义数据源轻松添加插件
3 Logstash结构原理
logstash 支持的数据类型
布尔、字节、字符串、数值、数组、键值对
logstash 支持的判断方法
==、!=、>、>=
logstash 支持的逻辑判断
in、notin、and、or、nand、xor
4 Logstash 安装部署
logstash 使用Java开发,没有默认的配置文件,需要手动配置
logstash 安装在 /usr/share/logstash 目录下,配置文件安装在 /etc/logstash 目录下,由于程序找不到配置文件路径,需要在 /usr/share/logstash 目录下创建一个名为 config的 /etc/logstash 的软链接
(1)准备工作
| 主机名称 | IP地址 | 配置 |
|---|---|---|
| logstash | 192.168.1.27 | 最低配置4核8G |
(2)安装部署
[root@logstash ~]# vim /etc/hosts
192.168.1.21    es-0001
192.168.1.22    es-0002
192.168.1.23    es-0003
192.168.1.24    es-0004
192.168.1.25    es-0005
192.168.1.27    logstash
[root@logstash ~]# dnf install -y logstash
[root@logstash ~]# ln -s /etc/logstash /usr/share/logstash/config
(3)最简单的配置
[root@logstash ~]# vim /etc/logstash/conf.d/my.conf
input {
  stdin {}
}

filter{

}

output{
  stdout{}
}
[root@logstash ~]# /usr/share/logstash/bin/logstash
(4)插件与调试格式
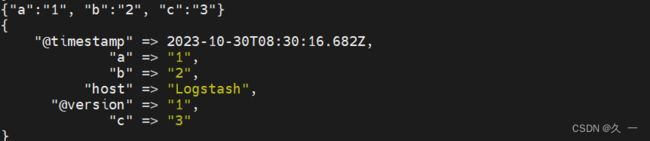
- json格式字符串: {"a":"1", "b":"2", "c":"3"}
[root@logstash ~]# vim /etc/logstash/conf.d/my.conf
input {
  stdin { codec => "json" }        // 标准输入的数据是json 格式编码
}

filter{

}

output{
  stdout{ codec => "rubydebug" }   // 标准输出的数据想使用调试格式编码
}
[root@logstash ~]# /usr/share/logstash/bin/logstash
测试 json 字符串
(5)插件管理
使用插件
logstash 对数据的处理依赖插件,上面的配置文件使用了logstash-input-stdin 和 logstash-output-stdout 两个插件
管理命令 /usr/share/logstash/bin/logstash-plugin
- 查看插件 list
- 安装插件 install
- 删除插件 uninstall
(6)插件与模块的关系
只能用于input 模块的插件:logstash-input-xxx
只能用于output模块的插件:ogstash-output-xxx
只能用于filter模块的插件:logstash-filter-xxx
编码插件不受模块的限制:logstash-codec-xxx
5 input 模块
(1)file 插件
- file插件是我们平常应用最广泛插件之一,他的主要用途是从本地文件中获取数据,并实时监控文件的变化
- 手册地址:[Logstash Reference [8.10] | Elastic]
(2)文件插件语法格式

(3)file插件基本配置
// 创建测试日志文件
[root@logstash ~]# touch /tmp/{a,b}.log
[root@logstash ~]# echo 'string 01' >>/tmp/a.log
[root@logstash ~]# echo 'string 02' >>/tmp/a.log
[root@logstash ~]# echo 'string 03' >>/tmp/a.log

// 配置 file 插件,读取日志文件
[root@logstash ~]# vim /etc/logstash/conf.d/my.conf
input {
  file {
    path => ["/tmp/a.log", "/tmp/b.log"]
  }
}
# filter { 不做任何修改 }
# output { 不做任何修改 }

# 启动程序,等待数据输出
[root@logstash ~]# /usr/share/logstash/bin/logstash

#---------------------------------------------------
# 在另一个终端模拟写入日志
[root@logstash ~]# echo 'string 10' >>/tmp/b.log
[root@logstash ~]# echo 'string 11' >>/tmp/a.log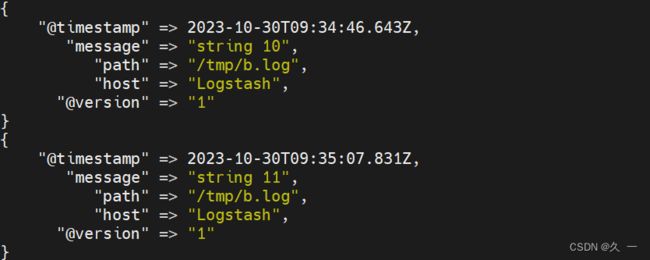
(4)核心参数
path 要监控的文件路径
path => ["/tmp/a.log","/tmp/b.log"]
start_position 第一次读取文件位置 [beginning end]
start position => "beginning"
sincedb_path 记录读取文件的位置
sincedb path => "/var/lib/logstash/sincedb-access"
(5)file插件高级配置
# 删除默认书签文件
[root@logstash ~]# rm -rf /var/lib/logstash/plugins/inputs/file/.sincedb_*
[root@logstash ~]# cat /tmp/{a.log,b.log} >/tmp/c.log
[root@logstash ~]# vim /etc/logstash/conf.d/my.conf
input {
  file {
    path => ["/tmp/c.log"]
    start_position => "beginning"
    sincedb_path => "/var/lib/logstash/sincedb"
  }
}
# filter { 不做任何修改 }
# output { 不做任何修改 }

[root@logstash ~]# /usr/share/logstash/bin/logstash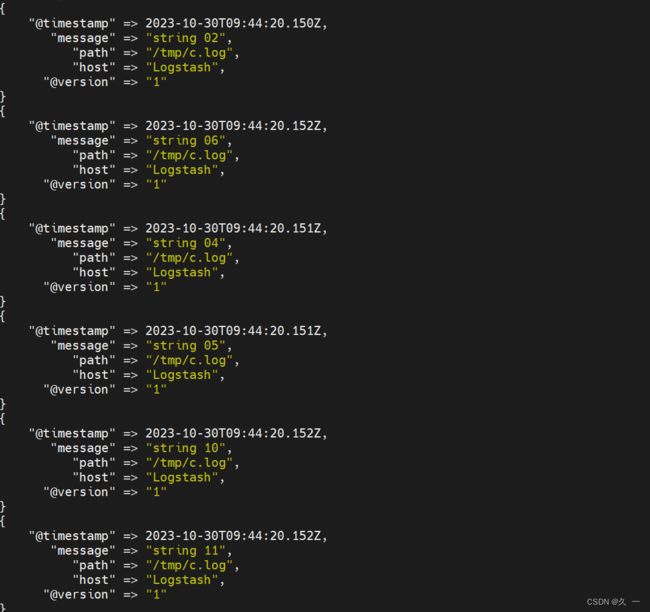
6 filter 模块
(1)grok 插件
解析各种非结构化的日志数据插件
grok 使用正则表达式把非结构化的数据结构化在分组匹配
正则表达式需要根据具体数据结构编写
虽然编写困难,但适用性极广
几乎可以应用于各类数据
(2)准备测试数据
# 从 web 服务器查找一条日志写入到日志文件
[root@logstash ~]# echo '60.26.217.109 - admin [13/Jan/2023:14:31:52 +0800] "GET /es/ HTTP/1.1" 200 148209 "http://127.70.79.1/es/" "curl/7.61.1"' >/tmp/c.log

# 调试技巧:设置路径为 /dev/null 可以多次反复测试
[root@logstash ~]# vim /etc/logstash/conf.d/my.conf
input {
  file {
    path => ["/tmp/c.log"]
    start_position => "beginning"
    sincedb_path => "/dev/null"
  }
}
# filter { 不做任何修改 }
# output { 不做任何修改 }

[root@logstash ~]# /usr/share/logstash/bin/logstash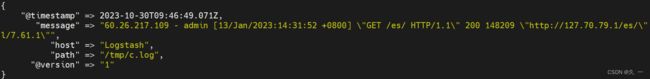
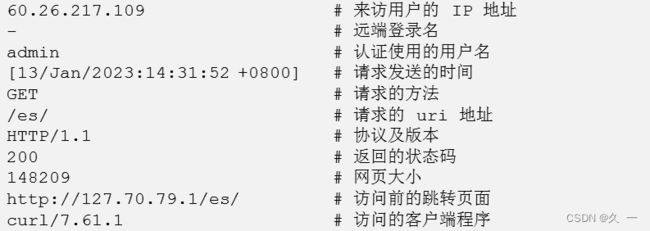
(3)日志格式解析
正则表达式分组匹配格式
调用格式:(?<名字>正则表达式)
调用宏表达式的格式
调用格式:%{宏名称:名字]
grok自带的宏定义在
/usr/share/logstash/vendor/bundle/jruby/2.5.0/gems/logstash-patterns-core-4.3.4/patterns
(4)匹配IP地址测试(获取IP地址)
[root@logstash ~]# vim /etc/logstash/conf.d/my.conf
# input { 不做任何修改 }

filter {
  grok {   // 使用正则表达式获取 IP 地址
    match => { "message" => "(?((25[0-5]|2[0-4]\d|1?\d?\d)\.){3}(25[0-5]|2[0-4]\d|1?\d?\d))" }
  }
  grok {   // 使用正则表达式宏获取 IP 地址
    match => { "message" => "%{IP:clientIP}" }
  }
}

# output { 不做任何修改 }

[root@logstash ~]# /usr/share/logstash/bin/logstash
(5)使用宏解析WEB日志
[root@logstash ~]# vim /etc/logstash/conf.d/my.conf
# input { 不做任何修改 }

filter{
  grok {
    match => { "message" => "%{HTTPD_COMBINEDLOG}" }
    remove_field => ["message"]
  }
}

# output { 不做任何修改 }

[root@logstash ~]# /usr/share/logstash/bin/logstash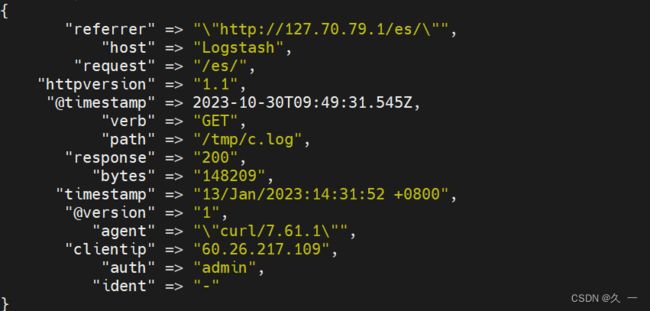
7 output 模块
(1)elasticsearch 插件
elasticsearch 插件是我们日志分析系统的数据输出插件,他的主要用途是把通过 filter 处理过的json数据写入到elasticsearch集群中
(2)elasticsearch插件语法格式
(3) 核心参数
hosts elasticsearch节点的地址,数组格式
hosts => ["es-0002:9200""es-0003:9200"]
index存储数据索引的名称
index => "weblog
index还支持安日期生成索引,其中YYYY表示年,MM表示月份,dd表示日期
index => "weblog-{ +YYYY.MM.dd)"
(4)把数据写入到elasticsearch集群的weblog索引中
[root@logstash ~]# vim /etc/logstash/conf.d/my.conf
# input { 不做任何修改 }
# filter { 不做任何修改 }

output{
  stdout{ codec => "rubydebug" }
  elasticsearch {
    hosts => ["es-0002:9200","es-0003:9200"]
    index => "weblog-%{+YYYY.MM.dd}"
  }
}

[root@logstash ~]# /usr/share/logstash/bin/logstash- 访问页面,查看 Head 插件,验证数据写入 Elasticsearch 成功
四 获取web日志
通过网络收集
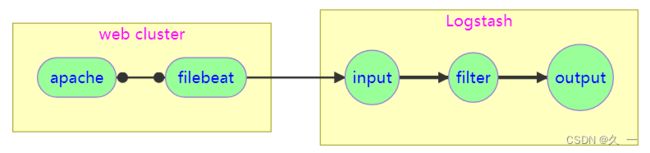
- 在 Web 服务器上部署 filebeat 日志采集程序
- filebeat 是使用 Golang 实现的轻量型日志采集器,也是Elasticsearch stack 里面的一员。
- filebeat 占用资源非常小,可以忽略不计
- filebeat 本质上是一个agent ,可以安装在应用服务器各个节点上,根据配置读取对应位置的日志文件,并通过网络上报到相应的服务中
1 beats 插件
(1)beats插件概述
beats 是 logstash input 模块的插件
专门用来接收 filebeat 发送过来的日志
默认监听在5044端口上
可以同时接收多台不同主机发送过来的日志信息
(2)使用 logstash 配置日志接收服务器
# 配置日志接受服务器
[root@logstash ~]# vim /etc/logstash/conf.d/my.conf
input {
  beats {
    port => 5044
  }
}
# filter { 不做任何修改 }
# output { 不做任何修改 }

# 启动logstash接受数据
[root@logstash ~]# /usr/share/logstash/bin/logstash
(3)filebeat安装配置
部署日志收集客户端
- 软件安装路径: /usr/share/filebeat
- 配置文件: /etc/filebeat/filebeat.yml
安装 filebeat,并设置开机自启动
[root@web-0001 ~]# dnf install -y filebeat
[root@web-0001 ~]# systemctl enable filebeat
[root@web-0001 ~]# vim /etc/filebeat/filebeat.yml
25:  id: my-filestream-id # 如果同时配置多个收集器,id不能重复
28:  enabled: true # 打开收集模块
32:  - /var/log/httpd/access_log # 日志文件路径
135: # 注释掉 Elasticsearch 配置
137: # 注释掉 Elasticsearch 配置
148: output.logstash: # 设置输出模块
150:   hosts: ["192.168.1.27:5044"] # 输出给logstash
163: # processors: 注释(用于收集系统信息)
164: #   - add_host_metadata: 注释掉(收集主机信息)
165: #       when.not.contains.tags: forwarded 注释掉(判断是否为容器)
166: #   - add_cloud_metadata: ~  注释掉(收集 cloud 信息)
167: #   - add_docker_metadata: ~ 注释掉(收集 docker 信息)
168: #   - add_kubernetes_metadata: ~ 注释掉(收集 kubernetes 信息)

[root@web-0001 ~]# rm -f /var/log/httpd/*
[root@web-0001 ~]# systemctl restart filebeat httpd

# 测试验证: 访问页面,观察 logstash 是否能够获取数据
[root@web-0001 ~]# curl http://192.168.1.11/info.php
2 多日志标签
如果系统中有多种类型的日志,我们可以使用标签区分日志种类
(1)设置标签
[root@web ~]# vim /etc/filebeat/filebeat.yml
# 设置识别标签
49:  fields:
50:    logtype: apache_log
# 清理冗余数据
164: processors:
165:   - drop_fields:
166:       fields:
167:         - log
168:         - offset
169:         - agent
170:         - ecs

[root@web ~]# systemctl restart filebeat

# 测试验证: 访问页面,观察 logstash 输出的数据变化
[root@web-0001 ~]# curl http://192.168.1.11/info.php
(2)使用标签
[root@logstash ~]# cat /etc/logstash/conf.d/my.conf
input {
  beats {
    port => 5044
  }
}


filter{
  if [fields][logtype] == "apache_log" {   // logstash 中基于标签配置不同规则
  grok {
    match => { "message" => "%{HTTPD_COMBINEDLOG}" }
    remove_field => ["message"]
  }}
}

output{
  stdout{ codec => "rubydebug" }
  if [fields][logtype] == "apache_log" {    // 为不同日志定义各自索引
  elasticsearch {
    hosts => ["es-0004:9200", "es-0005:9200"]
    index => "weblog-%{+YYYY.MM.dd}"
  }}
}

[root@logstash ~]# /usr/share/logstash/bin/logstash
(3)批量部署filebeat
filebeat 安装部署
- 在调试好一个结点之后,我们需要在整个 Web 集群安装部署 filebeat
- 编写 playbook 完成批量安装部署
[root@ecs-proxy ~]# cd website
[root@ecs-proxy website]# rsync -av 192.168.1.11:/etc/filebeat/filebeat.yml filebeat.j2
[root@ecs-proxy website]# vim filebeat.yaml
---
- name: 集群安装部署 filebeat
  hosts: web
  tasks:
  - name: 安装 filebeat
    dnf:
      name: filebeat
      state: latest
      update_cache: yes
  - name: 同步配置文件
    template:
      src: filebeat.j2
      dest: /etc/filebeat/filebeat.yml
      owner: root
      group: root
      mode: '0600'
  - name: 设置启动服务
    service:
      name: filebeat
      enabled: yes
  - name: 清理历史日志
    file:
      path: "{{ item }}"
      state: absent
    loop:
      - /var/log/httpd/access_log
      - /var/log/httpd/error_log
  - name: 重启服务
    service:
      name: "{{ item }}"
      state: restarted
    loop:
      - httpd
      - filebeat

[root@ecs-proxy website]# ansible-playbook filebeat.yaml
(4)验证日志收集
# 删除日志数据
[root@ecs-proxy ~]# curl -XDELETE "http://192.168.1.21:9200/weblog-*"
{"acknowledged":true}
# 通过浏览器访问 Web 集群页面,观察 head 插件,是否有数据写入
五 kibana
1 kibana概述
数据可视化平台工具
2 特点
灵活分析和可视化平台
实时流量统计报表
种类繁多的数据图表
为不同的用户定制分析界面
3 图列
4 安装部署
(1)准备工作
| 主机 | IP地址 | 配置 |
|---|---|---|
| kibana | 192.168.1.26 | 最低配置2核4G |
(2)安装kibana
[root@kibana ~]# vim /etc/hosts
192.168.1.21    es-0001
192.168.1.22    es-0002
192.168.1.23    es-0003
192.168.1.24    es-0004
192.168.1.25    es-0005
192.168.1.26    kibana
[root@kibana ~]# dnf install -y kibana
[root@kibana ~]# vim /etc/kibana/kibana.yml
02:  server.port: 5601
07:  server.host: "0.0.0.0"
23:  server.publicBaseUrl: "http://192.168.1.26:5601"
32:  elasticsearch.hosts: ["http://es-0004:9200", "http://es-0005:9200"]
115: i18n.locale: "zh-CN"
[root@kibana ~]# systemctl enable --now kibana- 使用 ELB 发布端口 5601,通过 WEB 浏览器访问验证
- 使用 kibana 完成数据统计分析
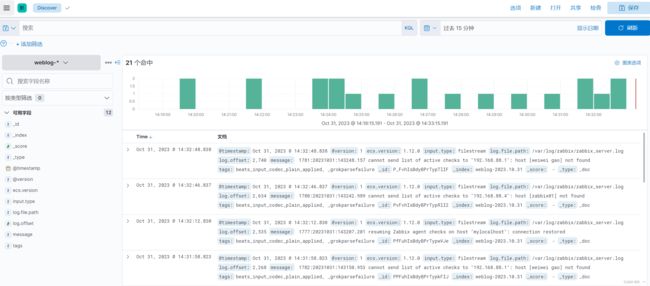
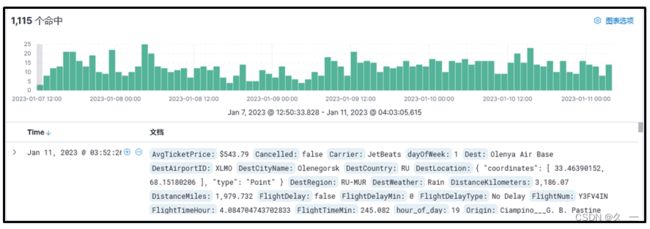
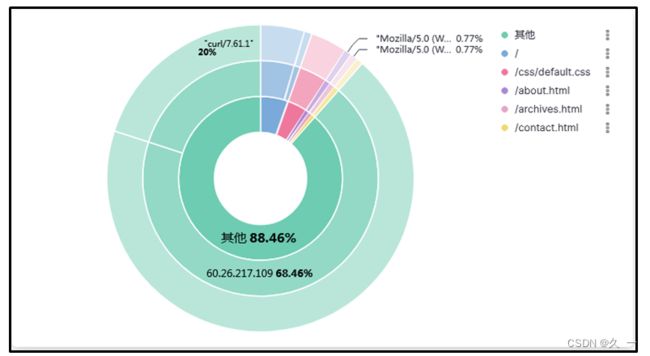
5 流量数据分析
(1)指定索引
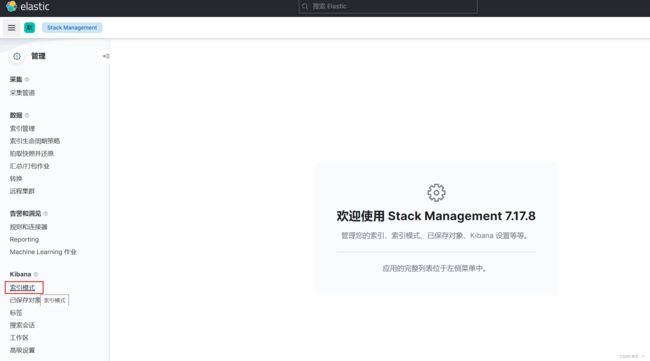
(2)创建索引