vscode debug skills
1) VSCode 调试 C/C++ 代码时,如何显示动态分配的指针数组。
创建一个动态分配的一维数组:
int n = 10;
int *array = (int *)malloc(n*sizeof(int));
memset(array, 1, n*sizeof(int));
如果直接 Debug 时查看 array 指针,并不能看到数组所有的值。
查看 Debug 窗口,有一个 Watch(监视窗口)小窗口,可以添加想要查看的变量的值。
添加 *(int(*)[10])array 或 *array@10 后就可以查看 array 数组的所有值,也就是添加:
- *(type(*)[size])pointer, 其中 type 是数组类型,size 是数组长度,pointer 是分配空间的数组指针。该方法将指针强制转化为一个数组。
- *pointer@size,该方法同样可以查看数组的值。(这种方法比较简便,不容易出错。)
查看多维数组通项的公式为:
-
**...arr@...@size2@size1
-
*(type(*)[size1][size2][...])arr
//等效于arr[2][3][4]
int ***arr;
int m = 2, n = 3, t = 4;
if((m > 0) && (n > 0) && (t > 0))
{
    arr = (int***)malloc(sizeof(int)*m);
    for(i = 0;i < m;i++)
    {
        arr[i] = (int**)malloc(sizeof(int)*n);
        for (k = 0;k < n;k++)
        {
                arr[i][k] = (int*)malloc(sizeof(int)*t);
        }
    }
}
在窗口中添加 ***arr@2@3@4 和 *(int(*)[3][2][4])arr,就可以查看数组的值。
如上也可以在 调试控制台 中输入想获取结果的变量名或者表达式获得当前的值。

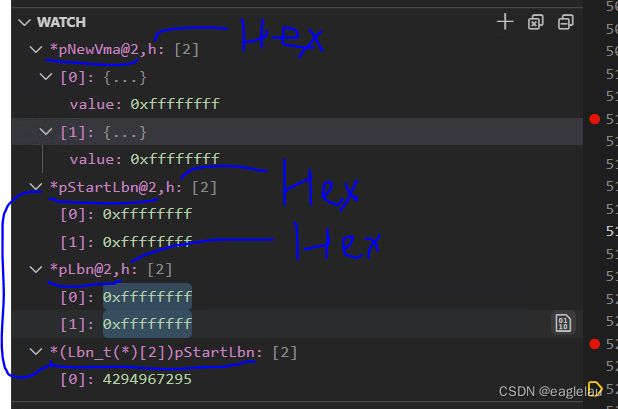
VSCode 调试时以 16 进制 (HEX) 查看变量
调试时 VSCode 变量值默认以 10 进制显示,如下图:

使用 "variable,x" 或者 "variable,h" 的格式就可以显示十六进制,不过貌似这种显示方式只支持 gdb C/C++ 语言调试,python 程序调试时亲测不可用。
我们将变量 vec 添加到监视,并编辑在 vec 后添加 h,即可查看 vec 的16进制数据,如下图:

同样的,添加 x 可以 16 进制显示,o 以 8 进制显示。
Does VS code have variable explorer object like we have it in spyder? - Stack Overflow
Working with Jupyter code cells in the Python Interactive window
https://www.cnblogs.com/haoliuhust/p/17630701.html
inline values:
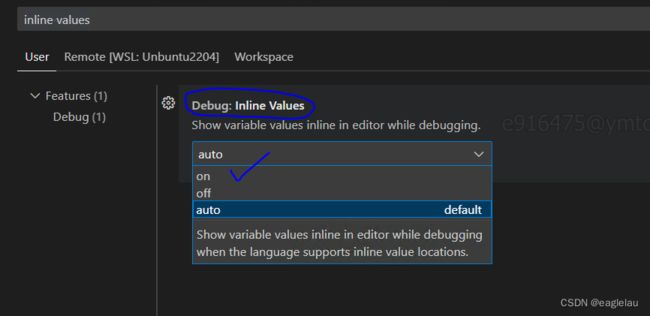
设置为 on:

VScode调试c代码时,如何显示动态分配的指针数组_vscode监视数组-CSDN博客
vscode调试时以16进制查看变量_vscode 16进制_虔诚的学习者的博客-CSDN博客
分享一些 VsCode 各场景相关的高级调试与使用技巧_前端达人的博客-CSDN博客
条件断点:在断点处右键点击,选择 "Edit Breakpoint",在弹出的窗口中勾选 "Condition" 并输入条件表达式,该断点只会在条件为真时被触发。
VScode调试C++代码时无法查看STL容器(string、vector等)_vs code无法打开string-CSDN博客
VSCode + TDM-GCC:
VScode虽然功能强大,但是自己是没法编译代码的,需要安装C++编译器:
TDM-GCC 10.3.0 release | tdm-gcc (jmeubank.github.io)
安装好后配置 Windows(10)环境变量:安装完成过后需配置环境变量: 我的电脑->属性->高级系统设置->环境变量->系统变量里找到path->编辑->>
把 C:\TDM-GCC-64\bin(根据你安装的位置,VSCode的没添加也一起添加) (系统变量相当于所有用户,所以一般修改系统变量的 path,path 就是命令行可以自动检索的地方)。
WinLibs 是 mingw 在 Windows 平台的分发库。WinLibs 专注于 Windows 下的GCC。优点是发布比较及时,发行版本丰富多样。免安装,多版本可以共存。
下载链接:WinLibs - GCC+MinGW-w64 compiler for Windows
如果用 C++ 仅仅是自己学习、不引入其他奇奇怪怪的库的话,下载 UCRT runtime 里的最新的Win64 压缩包就可以。下载好后,随便解压到一个地方就行,解压即可用。
去CMake官网:https://cmake.org/download/,拉到下面Binary distributions,下载Windows x64 ZIP,同样解压即可用。
配置环境变量:把你的 MinGW 和 CMake 解压路径下面的 bin 文件夹添加进 path,注意是 bin 文件夹。比如我的 MinGW 解压在 D:\CPP\environments\mingw64-ucrt,环境变量里就要添加D:\CPP\environments\mingw64-ucrt\bin。CMake 同理。
[极简教程]如何低成本、快速的在Windows电脑上搭建一个现代且干净的C++开发环境(VSCode+MinGW+CMake) - 知乎
配置 C/C++ 配置文件:c_cpp_properties.json 文件
在该文件 "includePath"处添加 TDM GCC 的 include 路径即可。
{
"configurations": [
{
"name": "Win32",
"includePath": [
"${workspaceFolder}/**"
//"C:\\TDM-GCC-64\\include",
//"C:\\TDM-GCC-64\\x86_64-w64-mingw32\\include"
],
"defines": [
"_DEBUG",
"UNICODE",
"_UNICODE"
],
"compilerPath": "C:\\TDM-GCC-64\\bin\\gcc.exe",
"cStandard": "c17",
"cppStandard": "gnu++14",
"intelliSenseMode": "windows-gcc-x64"
}
],
"version": 4
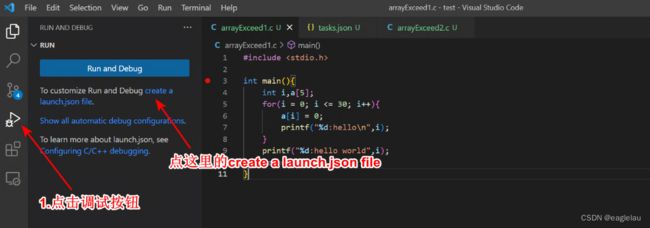
}配置 launch.json 文件:
按下图流程点击“调试”->C++(GDB/LLDB),会进入调试,并生成一个launch.json文件,若没有则选择添加配置再选C++(GDB/LLDB)。

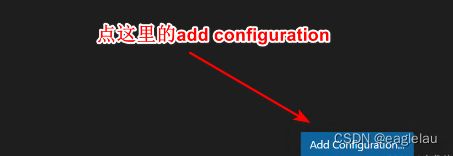
再添加配置选择gdb,就会出现如下配置代码:
{
    // 使用 IntelliSense 了解相关属性。
    // 悬停以查看现有属性的描述。
    // 欲了解更多信息,请访问: https://go.microsoft.com/fwlink/?linkid=830387
    "version": "0.2.0",
    "configurations": [

        {
            "name": "(gdb) 启动",
            "type": "cppdbg",
            "request": "launch",
            "program": "${fileDirname}\\${fileBasenameNoExtension}.exe",
            "args": [],
            "stopAtEntry": false,
            "cwd": "${fileDirname}",
            "environment": [],
            "externalConsole": false,
            "MIMode": "gdb",
            "miDebuggerPath": "C:\\TDM-GCC-64\\bin\\gdb.exe",
            "preLaunchTask": "compile",  // 调试会话开始前执行的任务, “preLaunchTask” 参数要和 task.json 文件中的 “label” 参数保持一致
            "setupCommands": [
                {
                    "description": "为 gdb 启用整齐打印",
                    "text": "-enable-pretty-printing",
                    "ignoreFailures": true
                },
                {
                    "description": "将反汇编风格设置为 Intel",
                    "text": "-gdb-set disassembly-flavor intel",
                    "ignoreFailures": true
                }
            ]

        }


    ]
}
配置 tasks.json 文件:
如果需要是c语言也就是gcc将下面的command项由g++改为gcc
如果是多文件编译(即函数声明和函数定义分开,不懂的别乱改),需要将args列表中的"${file}"项修改为"${workspaceFolder}/*.cpp" ,多文件推荐用cmake。
{
    "tasks": [
        {
            "type": "cppbuild",
            "label": "compile", //一定要和 launch.json 的 preLaunchTask 名字一致。任务的名字,就是在命令面板中选择的时候所看到的,可以自己设置。
            "command": "C:\\TDM-GCC-64\\bin\\g++.exe",
            "args": [ //编译时候的参数
                "-fdiagnostics-color=always",
                "-g",
                "${file}",
                "-o",
                "${fileDirname}\\${fileBasenameNoExtension}.exe",
                //"-fexec-charset=GBK", //GBK编码,用于解决Winows中文乱码
            ],
            "options": {
                "cwd": "${fileDirname}"
            },
            "problemMatcher": [
                "$gcc"
            ],
            "group": {
                "kind": "build",
                "isDefault": true
            },
            "detail": "调试器生成的任务。"
        },
    ],
    "version": "2.0.0"
}
task.json 的用途:用于指定编译器和链接文件等。默认路径在 .vscode下面。
如何打开一个 task.json 文件:

然后点击 configure default Build Task 后,点击 c/c++:gcc.exe 生成活动文件:
label:任务的名称,显示在下拉列表中。
command:指定编译器的路径。
args:命令行参数,用于传递给编译器。可以添加链接库等。
"-std=c++17"用于支持C++17语言功能
problemMatcher:运行问题解析器,用于查找错误和编译器输出中的警告。
group:组对象。
lauch.json 的用途:用于调试程序,默认路径在 .vscode 下面。
配置完后,右下角点击 “ Add Configuration...”
name: 给配置项的起一个易于理解的名称,调试过程中可以在调试按钮处看到:

type:根据开发语言决定。eg.node.js 的 type为 node,C/C++ 语言的 type 为 cppdbg。
request:指定调试模式,有 launch 和 attach 两种。使用 launch 可以为程序搭一个调试器,支持加断点。
program:指定要调试的程序。需要和 tasks.json 中的目标文件一致。
args:main 函数 (argc,argv) 的参数。启动时,传递到 main 函数中。
stopAtEntry: 如果想要在 main 函数停止,这里设为 true。
MIMode:配置调试器类型 gdb or lldb
miDebuggerPath: 配置调试器的路径(eg,gdb)。会自动搜索电脑中的调试器,根据 MIMode 的配置类型来找。
launch 和 attach 的区别:
- 以 launch 方式启动的时候,vscode 直接从本地项目启动并自动的为我们自动添加一个调试器,这也是为什么我们能在launch模式下打断点的原因。这是我们最经常用的。
- 而想以 attach 方式启动,通常需要一个已经在跑的项目,比如一个 web 服务,这个服务很可能是在远程或者在本地但是重启速度很慢的那种项目,因为这个 web 服务是在远程的我们没法打断点,但是可以通过 attach 启动的方式在这个远程的服务外面包裹一层调试器,达到调试的目的。
launch.json 文件中的 “preLaunchTask” 参数要和 task.json 文件中的 “label” 参数保持一致。
c_cpp_properties.json 的用途:主要用于配置 includePath,以使代码之间可以互相跳转,以及 C/C++标准,编译器等。
打开:点击右下角的 linux 或者 win32。

https://www.zhihu.com/question/336266287/answer/2144611720
最后给大家推荐一个VS Code的教程:https://www.bilibili.com/video/BV1Jf4y1S7Bw/?spm_id_from=333.788.videocard.0

VSCode 各种断点:
Debugging in Visual Studio Code
1. 右键

2. Run --> New Breakpoint

Logpoint: A Logpoint is a variant of a breakpoint that does not "break" into the debugger but instead logs a message to the console (DEBUG CONSOLE). Logpoints are especially useful for injecting logging while debugging production servers that cannot be paused or stopped.
A Logpoint is represented by a "diamond" shaped icon. Log messages are plain text but can include expressions to be evaluated within curly braces ('{}').
Expression condition: The breakpoint will be hit whenever the expression evaluates to true.
Hit count: The 'hit count' controls how many times a breakpoint needs to be hit before it will 'break' execution. Whether a 'hit count' is respected and the exact syntax of the expression vary among debugger extensions.
Condition and hit count editing support is also supported for function and exception breakpoints.
Inline breakpoints: Inline breakpoints will only be hit when the execution reaches the column associated with the inline breakpoint. This is particularly useful when debugging minified code which contains multiple statements in a single line.
An inline breakpoint can be set using Shift+F9 or through the context menu during a debug session. Inline breakpoints are shown inline in the editor.
Inline breakpoints can also have conditions. Editing multiple breakpoints on a line is possible through the context menu in the editor's left margin.
Function breakpoints: Instead of placing breakpoints directly in source code, a debugger can support creating breakpoints by specifying a function name. This is useful in situations where source is not available but a function name is known.
A function breakpoint is created by pressing the + button in the BREAKPOINTS section header and entering the function name. Function breakpoints are shown with a red triangle in the BREAKPOINTS section.
Data breakpoints: If a debugger supports data breakpoints, they can be set from the context menu in the VARIABLES view. The Break on Value Change/Read/Access commands will add a data breakpoint that is hit when the value of the underlying variable changes/is read/is accessed. Data breakpoints are shown with a red hexagon in the BREAKPOINTS section.