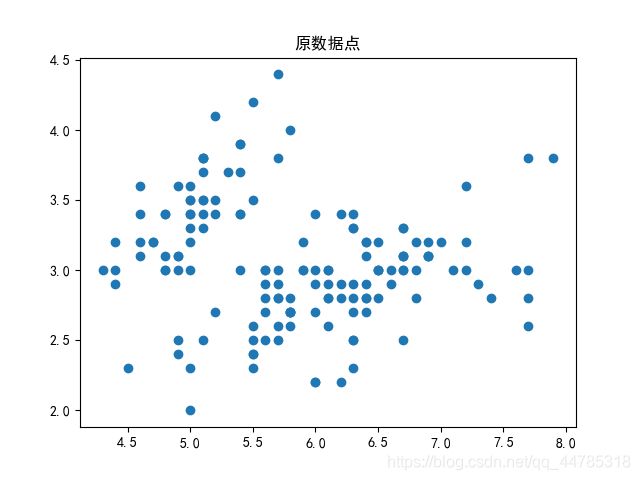
原数据(鸢尾花)
from sklearn import datasets    #导入内置数据集模块
iris=datasets.load_iris()   #导入鸢尾花的数据集
x=iris.data[:,0:2]    #样本数据共150个,取前两个特征,即花瓣长、宽

#可视化数据集
import matplotlib.pyplot as plt
plt.scatter(x[:,0],x[:,1]) #x的第0列绘制在横轴,x的第1列绘制在纵轴
plt.title("原数据点")
plt.show()
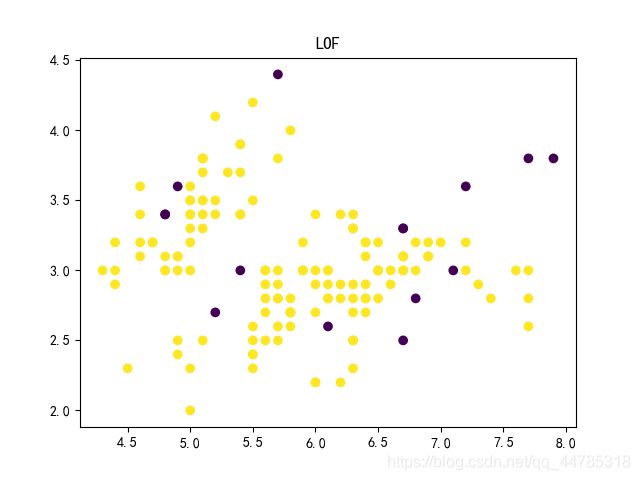
LOF
from sklearn.neighbors import LocalOutlierFactor
model = LocalOutlierFactor(n_neighbors=4, contamination=0.1)    #定义一个LOF模型,异常比例是10%,邻居距离为4
y = model.fit_predict(x)
#该方法一般为数据预处理,所以处理fit完的数据变为1/-1 -1为异常点
print(y)

#可视化预测结果
plt.scatter(x[:,0],x[:,1],c=y)  #样本点的颜色由y值决定
plt.title("LOF")
plt.show()

score = -model._decision_function(x)   #得到每个样本点的异常分数,注意这里要取负
#值越大越可能是异常点
print(score)
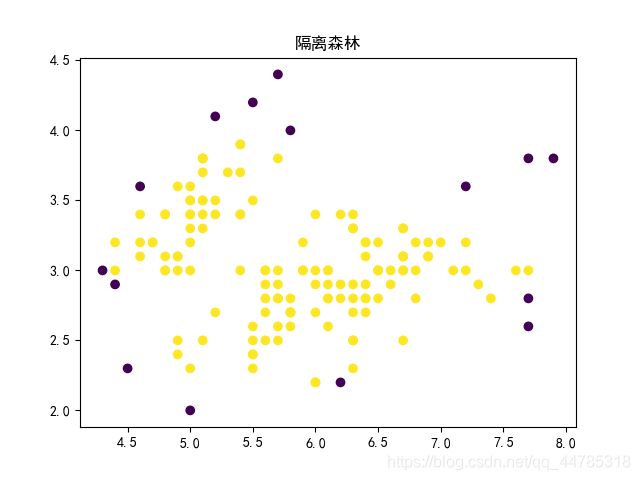
IForest
from sklearn.ensemble import IsolationForest
import pandas as pd
clf = IsolationForest(contamination=0.1, random_state=2018, n_jobs=-1, behaviour="new")
# predict / fit_predict方法返回每个样本是否为正常值,若返回1表示正常值,返回-1表示异常值
y_pred_train = clf.fit_predict(x)
#可视化预测结果
plt.scatter(x[:,0],x[:,1],c=y_pred_train)  #样本点的颜色由y值决定
plt.title("隔离森林")
plt.show()

pred = np.array(['正常' if i==1 else '异常' for i in y_pred_train])

# 分数越小于0,越有可能是异常值
scores_pred = clf.decision_function(x)
dict_ = {'anomaly_score':scores_pred, 'y_pred':y_pred_train, 'result':pred}
scores = pd.DataFrame(dict_)
# print(scores.sample(50))
PCA
import numpy as np
from sklearn.decomposition import PCA
from sklearn.preprocessing import StandardScaler
class PCA_Recon_Error:
def __init__(self, matrix, contamination=0.01, random_state=2018):
self.matrix = StandardScaler().fit_transform(matrix)
self.contamination = contamination
self.random_state = random_state
def get_ev_ratio(self):
pca = PCA(n_components=None, random_state=self.random_state)
pca_result = pca.fit_transform(self.matrix)
eigenvalues = pca.explained_variance_
ev_ratio = np.cumsum(eigenvalues) / np.sum(eigenvalues)
return ev_ratio
def reconstruct_matrix(self):
def reconstruct(recon_pc_num):
pca_recon = PCA(n_components=recon_pc_num, random_state=self.random_state)
pca_reduction = pca_recon.fit_transform(self.matrix)
recon_matrix = pca_recon.inverse_transform(pca_reduction)
assert_description = 'The shape of the reconstruction matrix should be equal to that of the initial matrix.'
assert recon_matrix.shape == self.matrix.shape, assert_description
return recon_matrix
col = self.matrix.shape[1]
recon_matrices = [reconstruct(i) for i in range(1, col+1)]
i, j = np.random.choice(range(col), size=2, replace=False)
description = 'The reconstruction matrices generated by different number of principal components are different.'
assert not np.all(recon_matrices[i] == recon_matrices[j]), description
return recon_matrices
def get_anomaly_score(self):
def compute_vector_length(vector):
square_sum = np.square(vector).sum()
return np.sqrt(square_sum)
def compute_sub_score(recon_matrix, ev):
delta_matrix = self.matrix - recon_matrix
score = np.apply_along_axis(compute_vector_length, axis=1, arr=delta_matrix) * ev
return score
ev_ratio = self.get_ev_ratio()
reconstruct_matrices = self.reconstruct_matrix()
anomaly_scores = list(map(compute_sub_score, reconstruct_matrices, ev_ratio))
return np.sum(anomaly_scores, axis=0)
def get_anomaly_indices(self):
indices_desc = np.argsort(-self.get_anomaly_score())
anomaly_num = int(np.ceil(len(self.matrix) * self.contamination))
anomaly_indices = indices_desc[:anomaly_num]
return anomaly_indices
def predict(self):
anomaly_indices = self.get_anomaly_indices()
pred_result = np.isin(range(len(self.matrix)), anomaly_indices).astype(int)
return pred_result
pca_error = PCA_Recon_Error(x, contamination=0.1, random_state=2018)
pca_matrix = pca_error.reconstruct_matrix()
pca_score = pca_error.get_anomaly_score()
pca_indices = pca_error.get_anomaly_indices()
list2=[]
for i in range(len(pca_score)):
if i in pca_indices:
list2.append(-1)
if i not in pca_indices:
list2.append(1)
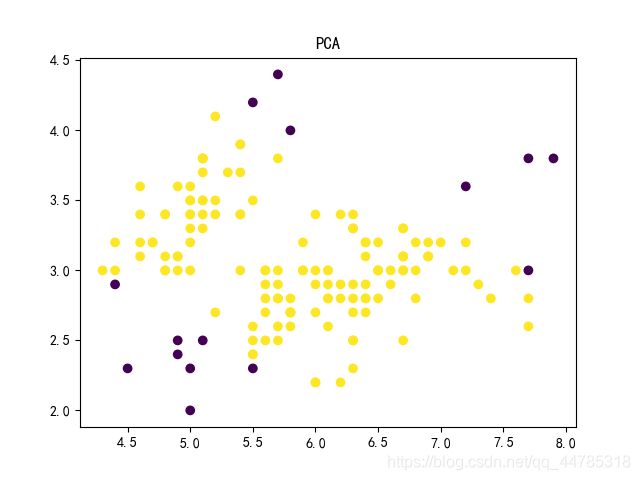
#可视化预测结果
plt.scatter(x[:,0],x[:,1],c=list2) #样本点的颜色由y值决定
plt.title("PCA")
plt.show()
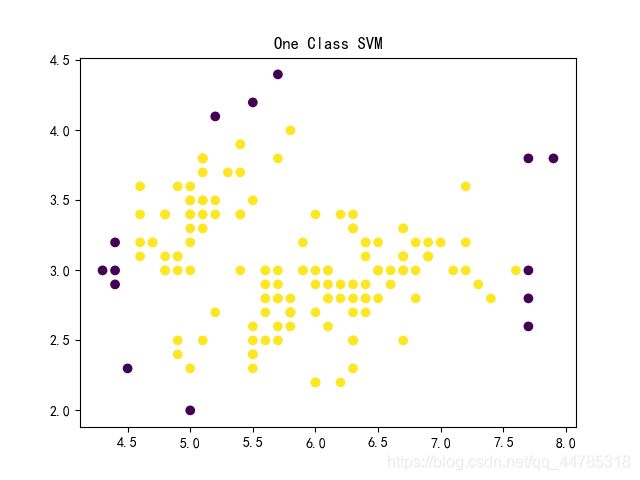
One-Class SVM