人工智能与机器学习---梯度下降法
一、梯度下降法
1、概述
梯度下降(gradient descent)在机器学习中应用十分的广泛,不论是在线性回归还是Logistic回归中,它的主要目的是通过迭代找到目标函数的最小值,或者收敛到最小值。
2、原理
梯度下降算法的基本原理就是通过多次迭代,求得与精度值匹配的最后结果:

二、牛顿法
1、牛顿法的概述
牛顿法是机器学习中用的比较多的一种优化算法。牛顿法的基本思想是利用迭代点处的一阶导数(梯度)和二阶导数(Hessen矩阵)对目标函数进行二次函数近似,然后把二次模型的极小点作为新的迭代点,并不断重复这一过程,直至求得满足精度的近似极小值。牛顿法的速度相当快,而且能高度逼近最优值。牛顿法分为基本的牛顿法和全局牛顿法。
2、牛顿法的原理
基本牛顿法是一种是用导数的算法,它每一步的迭代方向都是沿着当前点函数值下降的方向。
我们主要集中讨论在一维的情形,对于一个需要求解的优化函数,求函数的极值的问题可以转化为求导函数。对函数进行泰勒展开到二阶,得到
对上式求导并令其为0,则为![]() 即得到
即得到
三、实际应用
(一)、Excel和Python编程,分别完成函数的极值的求解
1、Excel
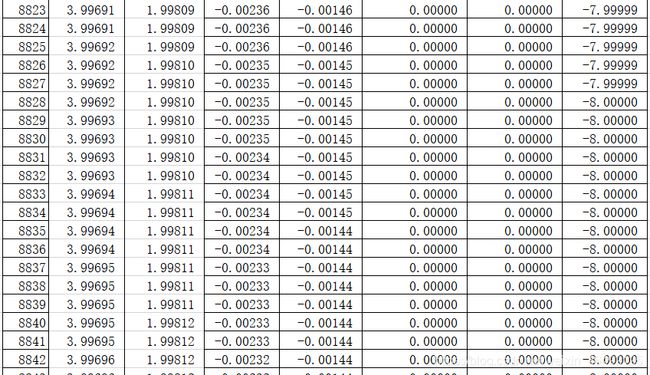
(1)添加公式,自动求出值
(2)寻找收敛
(3)确定极小点和极小值
极小点(3.99692,1.99810)
极小值:-8
2、Python编程
(1)导入包
import numpy as np
import matplotlib.pyplot as plt
import matplotlib as mpl
import math
from mpl_toolkits.mplot3d import Axes3D
import warnings
(2)二维原始图像
"""
对当前二维图像求最小点
1、随机取一个点(x1,x2),设定α参数值
2、对这个点分别求关于x1、x2的偏导数,x1 =x1 - α*(dY/dx1),x2 =x2 - α*(dY/dx2)
3、重复第二补,设置 y的变化量 小于多少时 不再重复。
"""
def f2(x, y):
return x**2+2*(y)**2 - 4*(x)-2*(x)*(y)
(3)偏函数
def hx1(x, y):
   return 2*x-4-2*y
def hx2(x, y):
   return 4*y-2*x

X1 = np.arange(-4,4,0.2)
X2 = np.arange(-4,4,0.2)

X1, X2 = np.meshgrid(X1, X2) # 生成xv、yv,将X1、X2变成n*m的矩阵,方便后面绘图
Y = np.array(list(map(lambda t : f2(t[0],t[1]),zip(X1.flatten(),X2.flatten()))))
Y.shape = X1.shape # 1600的Y图还原成原来的(40,40)


x1 = 1
x2 = 1
alpha = 0.1
(4)保存梯度下降经过的点
GD_X1 = [x1]
GD_X2 = [x2]
GD_Y = [f2(x1,x2)]
(5)定义y的变化量和迭代次数
y_change = f2(x1,x2)
iter_num = 0

while(y_change < 1e-10 and iter_num < 100) :
   tmp_x1 = x1 - alpha * hx1(x1,x2)
   tmp_x2 = x2 - alpha * hx2(x1,x2)
   tmp_y = f2(tmp_x1,tmp_x2)

   f_change = np.absolute(tmp_y - f2(x1,x2))
   x1 = tmp_x1
   x2 = tmp_x2
   GD_X1.append(x1)
   GD_X2.append(x2)
   GD_Y.append(tmp_y)
   iter_num += 1
print(u"最终结果为:(%.5f, %.5f, %.5f)" % (x1, x2, f2(x1,x2)))
print(u"迭代过程中X的取值,迭代次数:%d" % iter_num)
print(GD_X1)
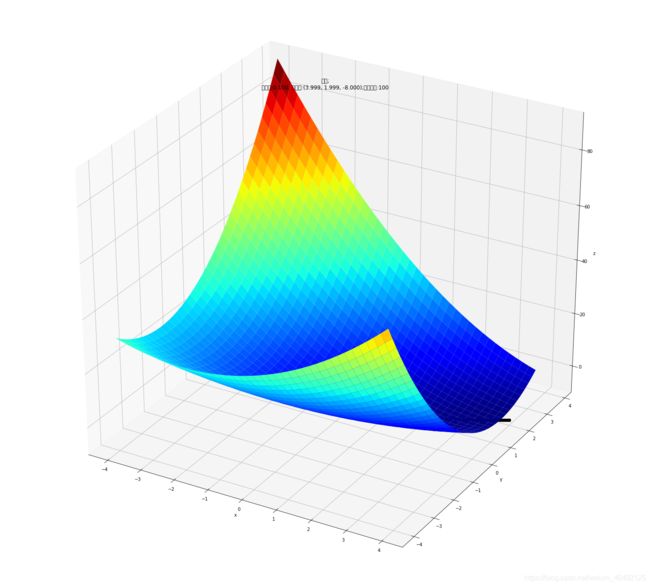
最终结果为:(3.99907, 1.99943, -8.00000)
迭代过程中X的取值,迭代次数:100
[1, 1.4, 1.68, 1.896, 2.0751999999999997, 2.2310399999999997, 2.3703679999999996, 2.4968576, 2.6126387199999996, 2.719076864, 2.8171465727999996, 2.90761138176, 2.9911114424319996, 3.0682070114303994, 3.1394007813324794, 3.2051500088360956, 3.2658736685842427, 3.321957132130058, 3.373755570805014, 3.421596660989794, 3.4657828742315058, 3.5065934930885985, 3.5442864256621753, 3.5790998589680623, 3.61125377526393, 3.6409513474235546, 3.6683802252768474, 3.693713722521222, 3.717111912407898, 3.7387226394617197, 3.7586824537869323, 3.7771174739385485, 3.7941441838477177, 3.8098701688538434, 3.824394795502385, 3.837809839407648, 3.8502000651496577, 3.861643761870156, 3.872213237952369, 3.8819752779104477, 3.8909915643755846, 3.899319067845221, 3.9070104066580527, 3.9141141794693763, 3.9206752723275837, 3.9267351422920918, 3.9323320793847913, 3.937501448530188, 3.9422759130129545, 3.9466856408648536, 3.950758495485095, 3.954520211698598, 3.957994558364595, 3.96120348856305, 3.964167278307848, 3.9669046546632454, 3.9694329140730904, 3.9717680316504986, 3.9739247621185383, 3.975916733039734, 3.977756530923471, 3.979455780755376, 3.9810252194511992, 3.9824747636993134, 3.983813572620511, 3.985050105641018, 3.9861921759444, 3.987246999840112, 3.9882212423606207, 3.9891210593752198, 3.9899521364866346, 3.990719724956192, 3.991428674884549, 3.9920834658576445, 3.9926882352515007, 3.9932468043747376, 3.993762702613972, 3.9942391897346763, 3.9946792764783994, 3.9950857435865013, 3.995461159370606, 3.9958078959407883, 3.996128144194037, 3.9964239276577045, 3.9966971152754103, 3.9969494332161846, 3.997182475781478, 3.9973977154789475, 3.9975965123266763, 3.99778012244661, 3.997949706001516, 3.9981063345256143, 3.9982509976951928, 3.9983846095819997, 3.9985080144289147, 3.998621991984401, 3.9987272624294388, 3.9988244909280777, 3.998914291830356, 3.998997232554144, 3.999073837170445]
(6)作图
fig = plt.figure(facecolor='w',figsize=(20,18))
ax = Axes3D(fig)
ax.plot_surface(X1,X2,Y,rstride=1,cstride=1,cmap=plt.cm.jet)
ax.plot(GD_X1,GD_X2,GD_Y,'ko-')
ax.set_xlabel('x')
ax.set_ylabel('y')
ax.set_zlabel('z')
ax.set_title(u'$ y = x1^2+2(x2)^2 - 4(x1)-2(x1) (x2) $')

ax.set_title(u'函数;\n学习率:%.3f; 最终解:(%.3f, %.3f, %.3f);迭代次数:%d' % (alpha, x1, x2, f2(x1,x2), iter_num))
plt.show()
(二)采用梯度下降法求解漫画书中的“店铺多元回归问题”
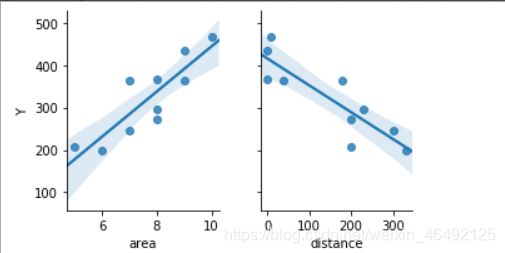
1、问题回顾
2、Jupyter Notebook +Python实现
(1)导入基本库、数据,并为变量赋值
import numpy as np
from matplotlib import pyplot as plt
from mpl_toolkits.mplot3d import Axes3D
data=np.genfromtxt('E:/面积距离车站数据.csv',delimiter=',')
x_data=data[:,:-1]
y_data=data[:,2]
(2)定义系数初始值以及学习率和迭代次数
#定义学习率、斜率、截据
#设方程为y=theta1*x1+theta2*x2+theta0
lr=0.00001
theta0=0
theta1=0
theta2=0
#定义最大迭代次数,因为梯度下降法是在不断迭代更新k与b
epochs=10000
(3)定义最小二乘法函数-损失函数(代价函数)
#定义最小二乘法函数-损失函数(代价函数)
def compute_error(theta0,theta1,theta2,x_data,y_data):
    totalerror=0
    for i in range(0,len(x_data)):#定义一共有多少样本点
        totalerror=totalerror+(y_data[i]-(theta1*x_data[i,0]+theta2*x_data[i,1]+theta0))**2
    return totalerror/float(len(x_data))/2
(3)定义梯度下降算法求解线性回归方程系数python函数
#梯度下降算法求解参数
def gradient_descent_runner(x_data,y_data,theta0,theta1,theta2,lr,epochs):
    m=len(x_data)
    for i in range(epochs):
        theta0_grad=0
        theta1_grad=0
        theta2_grad=0
        for j in range(0,m):
            theta0_grad-=(1/m)*(-(theta1*x_data[j,0]+theta2*x_data[j,1]+theta2)+y_data[j])
            theta1_grad-=(1/m)*x_data[j,0]*(-(theta1*x_data[j,0]+theta2*x_data[j,1]+theta0)+y_data[j])
            theta2_grad-=(1/m)*x_data[j,1]*(-(theta1*x_data[j,0]+theta2*x_data[j,1]+theta0)+y_data[j])
        theta0=theta0-lr*theta0_grad
        theta1=theta1-lr*theta1_grad
        theta2=theta2-lr*theta2_grad
    return theta0,theta1,theta2
(4)代用函数,进行系数求解,并打印
#进行迭代求解
theta0,theta1,theta2=gradient_descent_runner(x_data,y_data,theta0,theta1,theta2,lr,epochs)
print('结果:迭代次数:{0} 学习率:{1}之后 a0={2},a1={3},a2={4},代价函数为{5}'.format(epochs,lr,theta0,theta1,theta2,compute_error(theta0,theta1,theta2,x_data,y_data)))
print("多元线性回归方程为:y=",theta1,"X1+",theta2,"X2+",theta0)
结果:迭代次数:10000 学习率:1e-05之后 a0=5.495193211312626,a1=44.7066162322227,a2=-0.24740097765206576,代价函数为343.40239562281204
多元线性回归方程为:y= 44.7066162322227 X1+ -0.24740097765206576 X2+ 5.495193211312626
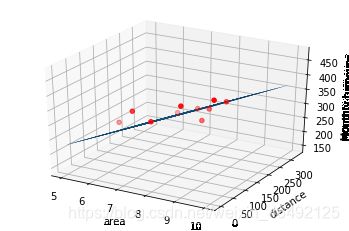
(5)画出回归方程线性拟合图
#画图
ax=plt.figure().add_subplot(111,projection='3d')
ax.scatter(x_data[:,0],x_data[:,1],y_data,c='r',marker='o')
x0=x_data[:,0]
x1=x_data[:,1]
#生成网格矩阵
x0,x1=np.meshgrid(x0,x1)
z=theta0+theta1*x0+theta2*x1
#画3d图
ax.plot_surface(x0,x1,z)
ax.set_xlabel('area')
ax.set_ylabel('distance')
ax.set_zlabel("Monthly turnover")
plt.show()
3、与之前的求解结果进行比较
(1)、Excel
(2)、最小二乘法
(3)结果
由于梯度下降算法的求解需要通过多次迭代,同时对比结果发现最小二乘法求解线性回归方程的精度优于梯度下降算法。
参考文献:
链接: link优化算法——牛顿法(Newton Method)
链接: link基于jupyter notebook的python编程


