echarts饼状图报错:series not exists. Legend data should be same with series name or data name显示饼状图异常
出现问题:使用后台返回的数据饼状图自动加载后显示不出来,在网页使用开发者模式查看有报错:series not exists. Legend data should be same with series name or data name,
排查过程:
1、在网上有的说是因为legend中的date和series中data里name不一致导致的,我经过打印出两者数据,经对比是一致的,排除该因素。
2、网上还有的说是一个页面上有多个echarts图表导致的,我的页面其实也有两个图表,但我感觉应该不会有这么低级的bug,于是直接在data后面写死数据显示正常,排除了其他的因素,这也说明是数组的数据格式和echarts要求的不一样。
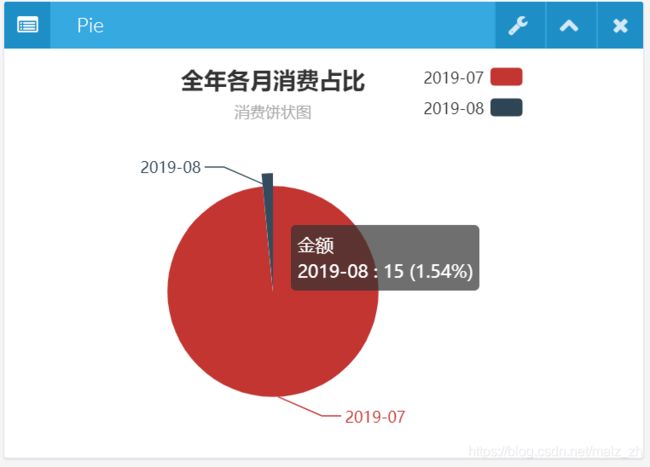
异常界面截图:
问题代码呈现:
function queryYearShow() {
    var months = new Array();
    var moneys = new Array();
    $.ajax({
        type : "POST",
        cache : false,
        dataType : "json",
        url :  "/consumer/queryYearShowPie",
        data:{
        },
        success: function(data){
            //console.log(data)
            //alert(data.toString());
            var list = data
            $.each(list,function (n,value) {
                months[n]=value.consumTime;
                moneys[n]="value:"+value.money+",name:"+value.consumTime;
            });
            queryYearShowPie(months,moneys);//month,money
        }
    });
}
function queryYearShowPie(month,money) {
    alert(month);
    alert(money);
    //基于准备好的DOM,初始化echarts实例--echarts.init() 方法初始化一个 ECharts 实例,在 init() 中传入图表容器 Dom 对象,
    var myChart = echarts.init(document.getElementById('pie_year'));
    //指定图表的配置项和数据
    var option = {
        title : {
            text: '全年各月消费占比',
            subtext: '消费饼状图',
            x:'center'
        },
        tooltip : {
            trigger: 'item',
            formatter: "{a}
{b} : {c} ({d}%)"
        },
        legend: {
            orient: 'vertical',
            left: 'right',
            data: month
        },
        series : [
            {
                name: '金额',
                type: 'pie',
                radius : '55%',
                center: ['50%', '60%'],
                data:money,
            }
        ]
    };
    //使用刚指定的配置项和数据显示图表
    myChart.setOption(option);
}
程序中数据说明:
其中数组month为:2019-07,2019-08
数组money为:{value:959.9999999999999,name:2019-07},{value:15,name:2019-08}
因素2排除方法:
直接在程序中写死:months=['2019-07','2019-08'];
moneys=[{value:959.9999999999999,name:'2019-07'},{value:15,name:'2019-08'}]; queryYearShowPie(months,moneys);//month,money
这时候alert出来的months为:2019-07,2019-08
moneys为:[object Object],[object Object]
这回显示正常了:
可以看出,其实正确的数据格式应该是,数组中的值是json对象,最初的代码是有问题的,
我也试过安装写死的数据格式对后台返回的代码进行拼装,依然是有问题的,代码如下:
$.each(list,function (n,value) {
    months[n]="'"+value.consumTime+"'";
    moneys[n]="{value:"+value.money+",name:'"+value.consumTime+"'}";
});
queryYearShowPie(months,moneys);//month,money
所以针对代码进行优化后完整的代码如下:
完美解决:


