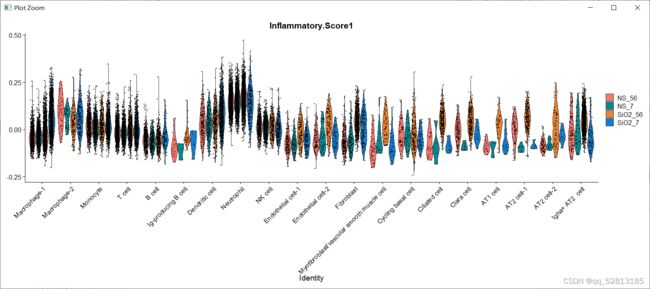
6_ggplot可视化addmodule得到的炎症评分自己选择颜色 ggplot自定义更改显示的颜色
library(Hmisc)
library(patchwork)
library(ggplot2)
library(ggalluvial)
library(svglite)
library(Seurat)
library(openxlsx)
library(harmony)
library(dplyr)


path="G:/silicosis/sicosis/silicosis_ST/yll/0214/harmony_cluster"
dir.create(path)
setwd(path)
#     load("G:/silicosis/sicosis/silicosis-1122-merge/silicosis_cluster_merge.rds")##	改路径
inflammatory_gene=read.xlsx("G:/silicosis/sicosis/silicosis_ST/yll/0214/harmony_cluster/HALLMARK_INFLAMMATORY_RESPONSE.xlsx")


library(Hmisc)
inflammatory_gene=capitalize(tolower(inflammatory_gene$gene_symbol)) %>% list()

#对给定的基因集合进行打分
All.merge=AddModuleScore(All.merge,
features = inflammatory_gene,
name = "Inflammatory Score")
#结果保存在这里
colnames([email protected])
```

```
#seurat自带函数可视化
VlnPlot(All.merge,features = "Inflammatory.Score1")
VlnPlot(All.merge,features = "Inflammatory.Score1",group.by = "stim")

VlnPlot(All.merge,features = "Inflammatory.Score1",split.by = "stim")

#开始使用ggplot画图,首先提取所需数据
getwd()
head([email protected])
names(All.merge)
glimpse(str(All.merge))    #必须!!vars是个向量!!!!!!!!!!!!!!1
head(All.merge@reductions)
mydata=FetchData(All.merge,vars = c("UMAP_1","UMAP_2","stim","cell.type","Inflammatory.Score1"))
head(mydata)

#炎症分数在umap图上的可视化
ggplot(data = mydata,aes(x=UMAP_1,y=UMAP_2,
                         colour=Inflammatory.Score1))+geom_point()+
  scale_color_gradientn(values = seq(0,1,0.2),colours = c('blue','cyan','green','yellow','orange','red'))+
  geom_point(size = 1)+
  facet_wrap(~stim)

head(mydata)
#加上边界线
ggplot(mydata,aes(cell.type,Inflammatory.Score1,
                  colour=stim,fill=stim))+geom_boxplot()+
     theme_bw()+RotatedAxis()

ggplot自定义更改现实的颜色
#更改fill的颜色
p=ggplot(mydata,aes(cell.type,Inflammatory.Score1,
                  colour=stim,fill=stim))+geom_boxplot()+
  scale_fill_manual(values = c('green','cyan','blue','yellow','orange','red'))+
  scale_color_manual(values = c('green','cyan','blue','yellow','orange','red'))+
  theme_bw()+RotatedAxis()

#更改fill的颜色
p=ggplot(mydata,aes(cell.type,Inflammatory.Score1,
                  fill=stim))+geom_boxplot()+
  scale_fill_manual(values = c('green','cyan','blue','yellow','orange','red'))+
  scale_color_manual(values = c('green','cyan','blue','yellow','orange','red'))+
  theme_bw()+RotatedAxis()

getwd()
jpeg("inflammatory-score-.jpeg",width = 14,height = 7,res = 400,units = 'in')
print(p)
dev.off()


