【ECharts】保姆级从空白项目到Echarts地图
前提
请先创建好一个空白的vue项目,准备好一个用于写Echarts地图的空白vue文件
准备好一个空白的vue页面后,只需要跟着我一步一步做 就可以达到我最后展示的效果!!!
资源下载
ECharts
npm install echarts
地图 json 文件
离线地图下载,下载后复制 json 文件地址链接后打开新标签页访问,再 ctrl + s 保存,重命名为 china-map.json 文件


基础地图
vue文件的完整代码如下所示。
import zhongguo from "@/assets/mapJson/china-map.json" 这里的 china-map.json 就是刚刚下载的离线地图 json 文件,地址要换成你所放的目录地址。
<template>
  <div class="content">

    <div ref="charts" style="width: 1000px; height: 800px">div>
  div>
template>


<script>
import * as echarts from "echarts";
import zhongguo from "@/assets/mapJson/china-map.json"
export default {
  created () {
    this.$nextTick(() => {
      this.initCharts();
    })
  },
  methods: {
    initCharts () {
      const charts = echarts.init(this.$refs["charts"]);
      const option = {
        // 背景颜色
        backgroundColor: "#062e74",
        // 提示浮窗样式
        tooltip: {
          show: true, // 控制提示框是否显示
          trigger: "item", // 指定何时触发提示框的显示
          alwaysShowContent: false, //控制提示框是否总是显示内容,false 表示提示框只在特定触发条件下显示
          backgroundColor: "#074e7b",
          borderColor: "#0a92c9",
          hideDelay: 100, // 鼠标移开后提示框消失的延迟时间(单位:毫秒)
          triggerOn: "mousemove", //指定触发提示框显示的方式(click: 当鼠标点击时触发提示框的显示)
          enterable: true, //控制是否可以通过鼠标进入提示框内部,允许与提示框内部的内容进行交互
          textStyle: {
            color: "#DADADA",
            fontSize: "12",
            width: 20,
            height: 30,
            overflow: "break",
          },
          showDelay: 100 //提示框显示的延迟时间,即鼠标悬停后经过多少时间才会显示提示框
        },
        // 地图配置
        geo: {
          map: "china",
          label: {
            // 通常状态下的样式
            normal: {
              show: true,
              textStyle: {
                color: "#fff",
              },
            },
            // 鼠标放上去的样式
            emphasis: {
              textStyle: {
                color: "#fff",
              },
            },
          },
          // 地图区域的样式设置
          itemStyle: {
            normal: {
              borderColor: "#47bdff",
              borderWidth: 1,
              areaColor: {
                type: "radial",
                x: 0.5,
                y: 0.5,
                r: 0.8,
                colorStops: [
                  {
                    offset: 0,
                    color: "rgba(147, 235, 248, 0)", // 0% 处的颜色
                  },
                  {
                    offset: 1,
                    color: "rgba(71, 189, 255, 0.1)", // 100% 处的颜色
                  },
                ],
                globalCoord: false, // 缺省为 false
              },
              shadowColor: "rgba(128, 217, 248, 1)",
              shadowOffsetX: -2,
              shadowOffsetY: 2,
              shadowBlur: 10,
            },
            // 鼠标放上去高亮的样式
            emphasis: {
              borderColor: "#fff",
              borderWidth: 5,
              areaColor: {
                type: "radial",
                x: 0.5,
                y: 0.5,
                r: 0.8,
                colorStops: [
                  {
                    offset: 0,
                    color: "rgba(147, 235, 248, 0)", // 0% 处的颜色
                  },
                  {
                    offset: 1,
                    color: "rgba(71, 189, 255, 0.1)", // 100% 处的颜色
                  },
                ],
                globalCoord: false, // 缺省为 false
              },
            },
          },
        },
      };
      // 地图注册,第一个参数的名字必须和option.geo.map一致
      echarts.registerMap("china", zhongguo)

      charts.setOption(option);
    },
  },
};
script>
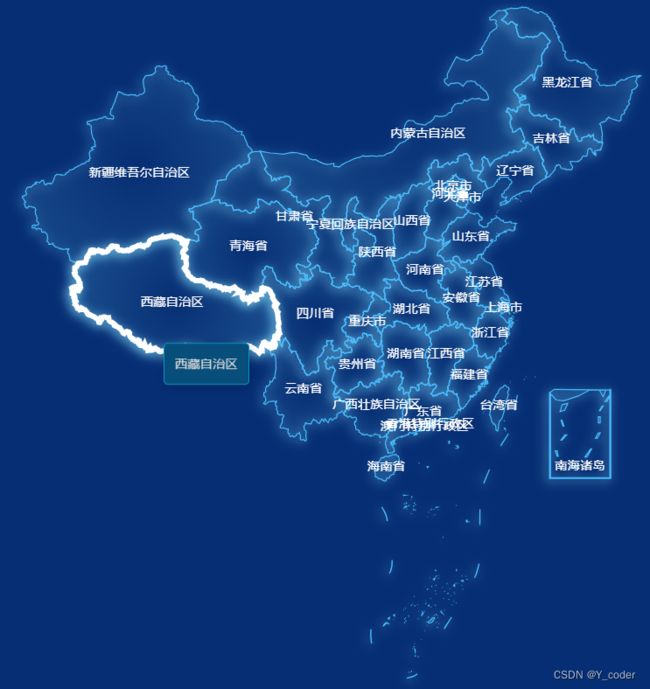
如果把上述内容粘贴进去,就可以看到如下效果。样式你可以自己进行调整。
标点
在 option 里添加 series 属性。这里给了两种样式
series: [
  // 样式一
  // {
  //   type: "scatter",
  //   coordinateSystem: "geo",
  //   symbol: "pin",
  //   legendHoverLink: true,
  //   symbolSize: [60, 60],
  //   // 这里渲染标志里的内容以及样式
  //   label: {
  //     show: true,
  //     formatter (value) {
  //       return value.data.value[2];
  //     },
  //     color: "#fff",
  //   },
  //   // 标志的样式
  //   itemStyle: {
  //     normal: {
  //       color: "rgba(255,0,0,.7)",
  //       shadowBlur: 2,
  //       shadowColor: "D8BC37",
  //     },
  //   },
  //   // 数据格式,其中name,value是必要的,value的前两个值是数据点的经纬度,其他的数据格式可以自定义
  //   // 至于如何展示,完全是靠上面的formatter来自己定义的
  //   data: [
  //     { name: "西藏", value: [91.23, 29.5, 2333] },
  //     { name: "黑龙江", value: [128.03, 47.01, 1007] },
  //   ],
  //   showEffectOn: "render",
  //   rippleEffect: {
  //     brushType: "stroke",
  //   },
  //   hoverAnimation: true,
  //   zlevel: 1,
  // },
  // 样式二
  {
    type: "effectScatter",
    coordinateSystem: "geo",
    effectType: "ripple",
    showEffectOn: "render",
    rippleEffect: {
      period: 10,
      scale: 10,
      brushType: "fill",
    },
    // 这里渲染标志里的内容以及样式
    label: {
      show: true,
      formatter (value) {
        return value.data.value[2];
      },
      color: "#fff",
    },
    hoverAnimation: true,
    itemStyle: {
      normal: {
        color: "rgba(0, 214, 232, 0.5)",
        shadowBlur: 10,
        shadowColor: "#333",
      },
    },
    zlevel: 1,
    data: [
      { name: "西藏", value: [91.23, 29.5, 1982] },
      { name: "黑龙江", value: [128.03, 47.01, 3421] },
    ],
  },
],


类似的,还需要什么花里花哨的效果根据属性去配置就好啦,网上有很多现成的效果代码