promethues in docker方案
一. prometheus
- 此文档全部基于docker构建,k8s构建后续完善
1. 简介
- 搭建非常简单,用好难
- prometheus容器中构建需要指定配置文件,否则起不来.
- prometheus的server端也是存储数据的
TSDB(时序数据库) - 2.0版本后大大提升了压缩了数据存储能力,我用的是
2.8.1 - 需要持久化数据有
--storage.tsdb.path启动参数表示数据存储的位置,我的数据目录为:/prometheus- 各配置文件
- 数据采集HTTP的
pull和push两种对应的数据采集传输方式pull是指:客户端安装已有的exporter(客户端插件)在系统后,exporter以守护进程的模式运行并开始采集数据,exporters本身也是和thhp,会建立一个端口,共外界访问.push是指:客户端或者服务端安装官方提供的pushgateway插件,然后使用我们运维自行开发的各种脚本把监控数据组织成key/value的形式,metrices形式发送给pushgateway之后,pushgateway会在推送给Prometheus.实现数据的监控- metrices的意思是:Prometheus监控中采集过来的数据,统一称为metrices
- 具体参考官网
2. 常用参数
-h, --help                          			显示帮助信息
--version                           			显示版本
--config.file="prometheus.yml"      			指定配置文件
--web.listen-address="0.0.0.0:9090" 			指定监听的端口
--web.max-connections=512           			最大连接数
--web.enable-lifecycle              			是否开启reload和shutdown的远程API
--web.enable-admin-api              			是否开启管理API
--web.console.templates="consoles"  			控制台模板目录
--web.console.libraries="console_libraries"  	控制台库文件目录
--storage.tsdb.path="data/"         			数据存储路径
--storage.tsdb.retention.time       			数据保留时间,默认15天
--query.timeout=2m                  			查询超时时间
--query.max-concurrency=20          			最大并发查询数量
--query.max-samples=50000000        			单次查询返回的最大样本数
--log.level=info                    			日志级别: [debug, info, warn, error]
--log.format=logfmt                 			日志输出格式:[logfmt, json]
二. 环境
| IP | houstname | 配置 | 备注 |
|---|---|---|---|
| 192.168.0.212 | ops-002 | 4c8g + 290G | centos7 |
1. 基础环境
# repo系统源和docker源
curl -o /etc/yum.repos.d/Centos-7.repo http://mirrors.aliyun.com/repo/Centos-7.repo
curl -o /etc/yum.repos.d/docker-ce.repo http://mirrors.aliyun.com/docker-ce/linux/centos/docker-ce.repo

yum -y update
ntpdate ntp2.aliyun.com
/sbin/hwclock --systohc
2. 镜像下载
官网
# 下载最新版本的prometheus的各个组件
docker pull prom/prometheus
docker pull  prom/node-exporter
docker pull  grafana/grafana
docker pull google/cadvisor
docker pull prom/blackbox-exporter
docker pull quay.io/prometheus/alertmanager
docker pull timonwong/prometheus-webhook-dingtalk
3. prometheus配置文件
- 编写的配置文件需要拷贝到容器中
- 这里的配置文件是最简单的,后续也需要完善配置文件,具体配置参考官网
# 创建目录,容器中使用的是65534用户启动的
mkdir -p /data/prometheus/conf
chown -R 65534. /data/prometheus
vim /data/prometheus/conf/prometheus.yml

global:
  scrape_interval:     15s	# 采集数据的时间间隔,默认15s
  evaluation_interval: 15s	# 评估规则的间隔时间,默认15s
alerting:					# alertmanagers用于告警
  alertmanagers:
  - static_configs:
    - targets:
      # - alertmanager:9093
rule_files:					# 规则配置文件
  # - "first_rules.yml"
  # - "second_rules.yml"
scrape_configs:				# 抓取哪里的数据到TSDB(时序数据库)
  - job_name: prometheus
    static_configs:
    - targets: ['localhost:9090']
  - job_name: docker
    static_configs:
    - targets: ['192.168.0.212:8080']
4. prometheus启动
- 后面会修改启动命令
# 启动prometheus服务端
docker run --restart=always -p 9090:9090 -v /data/prometheus/conf/prometheus.yml:/etc/prometheus/prometheus.yml -v /data/prometheus/data:/prometheus -d prom/prometheus

# docker宿主机上启动cadvisor
docker run --restart=always -v/var/run:/var:rw -v /sys/fs/cgroup/:/sys/fs/cgroup:ro -v /var/lib/docker/:/var/lib/docker:ro -p 8080:8080 -d google/cadvisor
三. 插件介绍
- 因为各个版本的指标可能有差异,想要知道你下载的版本有哪些指标,可以改你的IP和port来查看metrics
| 插件 | 说明 | 备注 |
|---|---|---|
| cadvisor | cadvisor可以搜集一台机器上所有运行的容器信息, 且提供基础查询界面和http接口 | |
| alertmanagers | 实现告警功能 | |
| node_exporter | 为server端提供被监控基础数据信息 | |
| blackbox_exporter | 监控端口,http、dns、tcp、icmp 的监控数据采集 | |
| mysql_exporter | 监控mysql | |
| … |
四. node_exporter
下载插件
- 利用
node_exporter实现服务器基础监控 node_exporter相当于是agent端, 在被监控的节点上安装
1. 安装
# 我下载的1.2.2版本,做好软连接,控制版本
tar xf node_exporter-1.2.2.linux-amd64.tar.gz
ln -s /opt/node_exporter-1.2.2.linux-amd64 /opt/node_exporter
ln -s /opt/node_exporter/node_exporter /usr/bin/node_exporter
which node_exporter
2. 加入system
vim /lib/systemd/system/node_exporter.service

[Unit]
Description=https://prometheus.io

[Service]
ExecStart=/opt/node_exporter/node_exporter
Restart=on-failure

[Install]
WantedBy=multi-user.target

# 启动服务,启动后还是检查一下是否起来并检查端口,默认是9100端口
systemctl daemon-reload
systemctl enable node_exporter;systemctl restart node_exporter
- 如果9100端口被占用
# 通过--web.listen-address=":9100"这条参数改默认端口,改了端口后,记得在server端也要改配置文件.
node_exporter --help
3. prometheus文件
- 这里只测试了2台被监控对象
global:
  scrape_interval:     15s
  evaluation_interval: 15s
alerting:
  alertmanagers:
  - static_configs:
    - targets:
      # - alertmanager:9093
rule_files:
  # - "first_rules.yml"
  # - "second_rules.yml"
scrape_configs:
  - job_name: prometheus
    static_configs:
    - targets: ['localhost:9090']
  - job_name: cadvisor-docker
    static_configs:
    - targets: ['192.168.0.212:8080']
  - job_name: node_exporter-agent
    static_configs:
    - targets: ['192.168.0.31:9100','192.168.0.212:9100']
五. grafana
模板下载
1. 启动
# 持久化并启动
mkdir /data/grafana
chmod -R 777 /data/grafana
docker run --restart=always --name=grafana -d -p 3000:3000 -v /data/grafana:/var/lib/grafana grafana/grafana
- 添加数据
[外链图片转存失败,源站可能有防盗链机制,建议将图片保存下来直接上传(img-yhJLdilm-1633345453676)(images/image-20210811104242314.png)]
- import模板
[外链图片转存失败,源站可能有防盗链机制,建议将图片保存下来直接上传(img-3Tf24hP4-1633345453680)(images/image-20210811113913428.png)]
[外链图片转存失败,源站可能有防盗链机制,建议将图片保存下来直接上传(img-KIBiCTHZ-1633345453681)(images/image-20210811104109616.png)]
2. 忘记密码
qlite3 /data/grafana/grafana.db
.tables
# 查看表中数据
select * from user;
# 更改密码为admin
update user set password = '59acf18b94d7eb0694c61e60ce44c110c7a683ac6a8f09580d626f90f4a242000746579358d77dd9e570e83fa24faa88a8a6', salt = 'F3FAxVm33R' where login = 'admin';
六. alertmanagers
官网解释
- Prometheus Server端通过静态或者动态配置去拉取
pull部署在k8s或主机上的各种类别的监控指标数据,然后基于PromQL对这些已经存储在本地存储HDD/SSD的TSDB中的指标定义阈值警报规则Rules。Prometheus会根据配置的参数周期性的对警报规则进行计算,如果满足警报条件,生产一条警报信息,将其推送到 Alertmanager 组件,Alertmanager 收到警报信息之后,会对警告信息进行处理,进行 分组Group并将它们通过定义好的路由Routing规则转到 正确的接收器receiver- 当然自定义的监控,一般都是通过
push的方式来实现
- 当然自定义的监控,一般都是通过
- 比如
EmailSlack钉钉、企业微信 Robot(webhook)企业微信等,最终异常事件Warning、Error通知给定义好的接收人,其中如钉钉是基于第三方通知来实现的,对于通知人定义是在钉钉的第三方组件中配置 - 在 Prometheus 中, 我们不仅仅可以对单条警报进行命名通过
PromQL定义规则,更多时候是对相关的多条警报进行分组后统一定义。这些定义会在后面说明与其管理方法。可以把 Alertmanager 中的分组Grouping、抑制Inhibition、延迟Silences - 告警插件,这里使用的钉钉接受告警消息
1. 钉钉告警
- 找到webhook
- 钉钉我用的是关键字,钉钉消息中必须有这个关键字,否则接受不到消息,或者用IP白名单
2. 启动容器
# 填自己的钉钉token
docker run --restart=always -d --name webhook -p 8060:8060 -v /data/webhook/conf/config.yml:/etc/prometheus-webhook-dingtalk/config.yml   timonwong/prometheus-webhook-dingtalk:latest --ding.profile="webhook1=https://oapi.dingtalk.com/robot/send?access_token=cd5e56c8446ad667b5b6acf21e27a26aec3b2e76f33883eb6727e60952f1f24f"
3. alertmanagers配置文件
- 配置文件及说明
alertmanager.yml
- rule规则如果有设置
for,经历evaluation_interval间隔后由inactive转换成pending,再经历evaluation_interval间隔后由pending转换成firing, 因此至少需要2倍的evaluation_interval,告警才会触发
global:
  resolve_timeout: 5m

# root route
route:
  group_by: ['docker', 'node', 'prometheus', 'instance']
  group_interval: 5m
  group_wait: 30s
  repeat_interval: 3h
  receiver: webhook

# will remain at the root node and be dispatched to 'default-receiver'.
  routes:
# A set of regex-matchers an alert has to fulfill to match the node.
#  - match_re:
#      service: ^(node|docker)$
#    receiver: webhook
# If any child route does not match, it will be sent directly to the recipient through the parent route configuration
  - match:
      severity: 'Critical'
    receiver: 'webhook'
  - match_re:
      severity: ^(Warning|Disaster)$
    receiver: 'webhook'
 # - receiver: ops
 #   group_wait: 10s
 #   match:
 #     status: 'High'

receivers:
- name: 'webhook'
  webhook_configs:
  - url: http://192.168.0.212:8060/dingtalk/webhook1/send
    send_resolved: true

#inhibit_rules:
#  - source_match:
#      status: 'High'
#    target_match:
#      status: 'Warning'
#    equal: ['alertname','operations', 'instance']
4. 启动alertmanager
docker run -d -p 9093:9093 --restart=always --name alertmanager -v /data/alertmanager/conf/alertmanager.yml:/etc/alertmanager/alertmanager.yml -v /data/alertmanager/data:/alertmanager prom/alertmanager
5. 告警模板
-
模板语法是 golang 的 text/template, 需要一定的学习来掌握,可以使用 sprig 提供的各种工具简化模板编写。
-
prometheus自带的模板如果不习惯可以自定义模板,前提是得支持中文
- docker起的webhook默认
/etc/prometheus-webhook-dingtalk/templates/default.tmpl - 如果不支持中文可以加个触发时间:
- 这是
Go语言的语法,复制即可 **触发时间:** {{ .StartsAt.Format "2006-01-02 15:04:05" }}
- 这是
- docker起的webhook默认
-
我用的是容器默认的模板,不支持中文,效果还行,先把之前的模板cp出来在修改.
[外链图片转存失败,源站可能有防盗链机制,建议将图片保存下来直接上传(img-p5sl3Myl-1633345453684)(images/image-20210818111020141.png)]
{{ define "__subject" }}[{{ .Status | toUpper }}{{ if eq .Status "firing" }}:{{ .Alerts.Firing | len }}{{ end }}] {{ .GroupLabels.SortedPairs.Values | join " " }} {{ if gt (len .CommonLabels) (len .GroupLabels) }}({{ with .CommonLabels.Remove .GroupLabels.Names }}{{ .Values | join " " }}{{ end }}){{ end }}{{ end }}
{{ define "__alertmanagerURL" }}{{ .ExternalURL }}/#/alerts?receiver={{ .Receiver }}{{ end }}
{{ define "__text_alert_list" }}{{ range . }}
**Labels**
{{ range .Labels.SortedPairs }}> - {{ .Name }}: {{ .Value | markdown | html }}
{{ end }}
**Annotations**
{{ range .Annotations.SortedPairs }}> - {{ .Name }}: {{ .Value | markdown | html }}
{{ end }}
**Source:** [{{ .GeneratorURL }}]({{ .GeneratorURL }})
{{ end }}{{ end }}
{{ define "default.__text_alert_list" }}{{ range . }}
**告警主题:** {{ .Annotations.summary }}
**报警描述:** {{ .Annotations.description }}
**触发时间:** {{ dateInZone "2006.01.02 15:04:05" (.StartsAt) "Asia/Shanghai" }}
**告警展示:** []({{ .GeneratorURL }})
**详细列表:**
{{ range .Labels.SortedPairs }}{{ if and (ne (.Name) "severity") (ne (.Name) "summary") }}> - {{ .Name }}: {{ .Value | markdown | html }}
{{ end }}{{ end }}
{{ end }}{{ end }}
{{/* Default */}}
{{ define "default.title" }}{{ template "__subject" . }}{{ end }}
{{ define "default.content" }}#### \[{{ .Status | toUpper }}{{ if eq .Status "firing" }}:{{ .Alerts.Firing | len }}{{ end }}\] **[{{ index .GroupLabels "alertname" }}]({{ template "__alertmanagerURL" . }})**
{{ if gt (len .Alerts.Firing) 0 -}}

**告警触发**
{{ template "default.__text_alert_list" .Alerts.Firing }}
{{- end }}
{{ if gt (len .Alerts.Resolved) 0 -}}
**告警恢复**
{{ template "default.__text_alert_list" .Alerts.Resolved }}
{{- end }}
{{- end }}
{{/* Legacy */}}
{{ define "legacy.title" }}{{ template "__subject" . }}{{ end }}
{{ define "legacy.content" }}#### \[{{ .Status | toUpper }}{{ if eq .Status "firing" }}:{{ .Alerts.Firing | len }}{{ end }}\] **[{{ index .GroupLabels "alertname" }}]({{ template "__alertmanagerURL" . }})**
{{ template "__text_alert_list" .Alerts.Firing }}
{{- end }}
{{/* Following names for compatibility */}}
{{ define "ding.link.title" }}{{ template "default.title" . }}{{ end }}
{{ define "ding.link.content" }}{{ template "default.content" . }}{{ end }}
6. 告警消息出图
- 告警信息配置出图,如果是容器构建的prometheus,默认打开的的地址会找不到真正prometheus,就需要在prometheus启动的时候加上一个参数
--web.external-url=http://yg.prometheus.com,这只域名,告警消息就会匹配到
7. 抑制
- 同一条告警,但是级别不一样,会触发多条告警,于是就有了抑制的功能
- CPU占用60%有一个
Warning的告警, CPU占用80%有一个Critical的告警,当容器使用了85%的CPU,那么就会触发2条告警 - 为防止告警风暴,必须做抑制
- CPU占用60%有一个
- 案例
- go语言的多任务操作
gorouting
- go语言的多任务操作
  - alert: Goroutines_High
    expr: go_goroutines{job="prometheus"} > 100
    for: 3m
    labels:
      status: Warning
    annotations:
      summary: "Instance {{$labels.instance}}: too much gorouting"
      description: "{{$labels.instance}} of job {{ $labels.job }} gorouting is {{ $value }}"

  - alert: Goroutines_High
    expr: go_goroutines{job="prometheus"} > 200
    for: 3m
    labels:
      status: Critical
    annotations:
      summary: "Instance {{$labels.instance}}: too much gorouting"
      description: "{{$labels.instance}} of job {{ $labels.job }} gorouting is {{ $value }}"
- 抑制规则
- 抑制规则在
latermanage.yml配置
- 抑制规则在
inhibit_rules:
  - source_match:
    # ddaltername: 'Goroutines_High'	# 可以加上,也可以不加,不加就匹配所有的
      status: 'Critical'
    target_match:
      status: 'Warning'
    equal: ['node', 'instance']
- 案例
inhibit_rules:
  - source_match:
      status: 'Critical'
    target_match:
      status: 'Warning'
    equal: ['node', 'instance', 'port', 'ssl', 'push']

  - source_match:
      target: 'Blackbox'
    target_match:
      target: 'Blackbox_Managed'
    equal: ['port','ssl']

  - source_match:
      target: Cadvisor
    target_match:
      target: Cadvisor_Managed
    equal: ['port','docker']

  - source_match:
      target: Node
    target_match:
      target: Node_Managed
    equal: ['port','node']
8. 静默
-
比如要临时调整服务器,需要关闭服务器,那么自己肯定知道会在什么时候报警,为防止告警风暴,配置静默规则
-
prometheus告警的静默只需要打开
AlertManagerWeb界面,点击Silence,再点击New Silence按钮创建规则,不需要配置文件
七. prometheus
(一). 标签处理
- prometheus的每个标签通常都有一个默认值,例如
__metrics_path__默认为/metrics__scheme__默认为http- 如果路径中存在任何URL参数,则它们的前缀会设置为
__param_*
[外链图片转存失败,源站可能有防盗链机制,建议将图片保存下来直接上传(img-zDriQq9s-1633345453687)(images/image-20210819163234171.png)]
# 案例:覆盖标签内容
  - job_name: docker
    scheme: https
    metrics_path: /moremetrics
    static_configs:
    - targets: ["192.168.0.232:9091"]

# 通过targets查看时,元属性就变成了: https://192.168.0.232:9091/moremetrics
- 配置文件中的
relabel_configs, 可以在target被抓取之前动态重写目标的标签集。每个scrape可以配置多个relabel,对不同的标签进行不同的操作。relable的过程可以分为:relabel之前,relabel期间,relabel之后。relabel_configs不能操作指标中的标签,只能操作relabel之前的标签。即__开头的和job这些relabel之前,除了自定义的标签外,还有一些其他的标签 job,这个标签的值是配置文件中job_name配置的值__address__这个标签的值是要抓取的地址和端口: instance这个标签,在relabel之前是没有的,如果relabel期间也没有设置instance标签,默认情况下instance标签的值就是__address__的内容__scheme__: http或https__metrics_path__: metrics的路径__param_: http请求参数,replace: 根据 regex 的配置匹配 source_labels 标签的值(注意:多个 source_label 的值会按照separator 进行拼接),并且将匹配到的值写入到 target_label 当中,如果有多个匹配组,则可以使用 ${1}, ${2}确定写入的内容。如果没匹配到任何内容则不对 target_label 进行重新, 默认为 replacekeep: 丢弃 source_labels 的值中没有匹配到正则表达式内容的 Target 实例drop: 丢弃 source_labels 的值中匹配到正则表达式内容的 Target 实例hashmod: 将 target_label 设置为关联的 source_label 的哈希模块labelmap: 根据 正则去匹配 Target 实例所有标签的名称(注意是名称),并且将捕获到的内容作为为新的标签名称, 正则匹配到标签的的值作为新标签的值,如果节点的标签少可以用这个来添加标签labeldrop: 对 Target 标签进行过滤,会移除匹配过滤条件的所有标签labelkeep: 对 Target 标签进行过滤,会移除不匹配过滤条件的所有标签
# 案例
scrape_configs:
  - job_name: pushgateway
    static_configs:
    - targets: ['192.168.0.212:10250']

  relabel_configs:
  - source_labels: [__address__]
    regex: '(.*):10250'
    replacement: '${1}:9100'
    target_label: __address__
    action: replace

# 最终192.168.0.212:10250变为192.168.0.212:9100
1. 添加标签
  - job_name: 'nacos_cluster'
    static_configs:
      - targets: ["192.168.0.212:8848"]
        labels:
          service: "cluster"		# 添加一个标签service为cluster的标签
(二). 环境
1. 修改prometheus配置文件
- 让
altermanager加入prometheus中
vim /data/prometheus/conf/prometheus.yml

global:
  scrape_interval:     15s
  evaluation_interval: 15s
alerting:
  alertmanagers:
  - static_configs:
    - targets: ['192.168.0.212:9093']
rule_files:
  - "prom/rules/*-rule.yml"

scrape_configs:
  - job_name: prometheus
    static_configs:
    - targets: ['localhost:9090']

  - job_name: node
    file_sd_configs:
    - files:
      - prom/targets/node-target.yaml
      refresh_interval: 2m

  - job_name: docker
    file_sd_configs:
    - files:
      - prom/targets/docker-target.yaml
      refresh_interval: 2m

  - job_name: pushgateway
    static_configs:
    - targets: ['192.168.0.212:9091']
- 文件服务发现列表
2. rules
- 将node-rules.yml挂载到容器中去,如上面的配置文件也要说明
vim /data/prometheus/conf/server/node-rules.yml

groups:
- name: node
  rules:
  - alert: CPU_High
    expr: (1 - (sum(increase(node_cpu_seconds_total{mode="idle"}[1m])) by (instance) / sum(increase(node_cpu_seconds_total[1m])) by (instance))) * 100 > 10
    for: 3m
    labels:
      status: Critical
    annotations:
      summary: "Instance {{ $labels.instance }}: High CPU usage"
      description: "{{ $labels.instance }} of job {{ $labels.job }} CPU usage is {{ $value }}"

  - alert: Free_High
    expr: 100 - (node_memory_MemFree_bytes + node_memory_Cached_bytes + node_memory_Buffers_bytes) / node_memory_MemTotal_bytes*100 > 80
    for: 3m
    labels:
      status: Critical
    annotations:
      summary: "Instance {{ $labels.instance }}: High Free usage"
      description: "{{ $labels.instance }} of job {{ $labels.job }} Free usage is {{ $value }}"

  - alert: Partition_High
    expr: 100 - node_filesystem_free_bytes{fstype=~"xfs|ext4"} / node_filesystem_size_bytes{fstype=~"xfs|ext4"} * 100 > 80
    for: 3m
    labels:
      status: Critical
    annotations:
      summary: "Instance {{ $labels.instance }}: High Partition usage"
      description: "{{ $labels.instance }} of job {{ $labels.job }} Partition usage is {{ $value }}"

  - alert: Load_High
    expr: node_load5 > on(instance) 2 * count(node_cpu_seconds_total{mode="idle"}) by (instance)
    for: 3m
    labels:
      status: Critical
    annotations:
      summary: "Instance {{ $labels.instance }}: High Load usage"
      description: "{{ $labels.instance }} of job {{ $labels.job }} Load is {{ $value }} "

  - alert: Server_Down
    expr: up == 0
    for: 1s
    labels:
      status: Disaster
    annotations:
      summary: "{{$labels.instance}}: Server is Down"
      description: "{{$labels.instance}} of job {{ $labels.job }} Server is Down"
1. rules配置说明
| KEY | 说明 |
|---|---|
| name | 警报规则组的名称 |
| alert | 警报规则的名称 |
| expr | PromQL表达式 |
| lable_name | 自定义标签,允许自行定义标签附加在警报上,比如high, warning |
| annotations | 用来设置有关警报的一组描述信息,其中包括自定义的标签,以及expr计算后的值 |
| for | 在第一次遇到新的表达式输出向量元素,和将此警告作为此元素的触发计数之间等待一段时间,在这种情况下,Prometheus将在每次评估期间检查警报是否继续处于活动状态时间,然后再触发警报。 处于活动状态但尚未触发的元素处于pending状态。 |
| labels | 允许指定要附加到警报的一组附加标签。 任何现有的冲突标签都将被覆盖。 标签值可以是模板化的。 |
2. ecording rules
ecording rules是提前设置好一个比较花费大量时间运算或经常运算的表达式,其结果保存成一组新的时间序列数据。当需要查询的时候直接会返回已经计算好的结果,这样会比直接查询快,同时也减轻了PromQl的计算压力,同时对可视化查询的时候也很有用,可视化展示每次只需要刷新重复查询相同的表达式即可- 在配置的时候,除了
record需要注意,其他的基本上是一样的,一个groups下可以包含多条规则rules,Recording和Rules保存在group内,Group中的规则以规则的配置时间间隔顺序运算,也就是全局中的evaluation_interval设置
# 这个配置的规则其实就是根据 record 规则中的定义,Prometheus 会在后台完成 expr 中定义的 PromQL 表达式周期性运算,以 job 为维度使用 sum 聚合运算符 计算 函数rate 对http_requests_total 指标区间 10m 内的增长率,并且将计算结果保存到新的时间序列 job:http_requests_total:rate10m 中,同时还可以通过 labels 为样本数据添加额外的自定义标签,但是要注意的是这个 Lables 一定存在当前表达式 Metrics 中
groups:
- name: http_requests_total
  rules:
  - record: job:http_requests_total:rate10m
    expr: sum by (job)(rate(http_requests_total[10m]))
    lables:
      team: operations
  - record: job:http_requests_total:rate30m
    expr: sum by (job)(rate(http_requests_total[30m]))
    lables:
      team: operations
3. prometheus变量
- 模板是在警报中使用时间序列标签和值展示的一种方法,可以用于警报规则中的注释(annotation)与标签(lable),模板其实使用的go语言的标准模板语法,并公开一些包含时间序列标签和值的变量。这样查询的时候,更具有可读性,也可以执行其他PromQL查询,来向警报添加额外内容,ALertmanager Web UI中会根据标签值显示器警报信息
{{ $lable.node}} 		# 可以获取当前警报实例中的标签是node的实例
{{ $value }} 			# 变量可以获取当前PromQL表达式的计算样本值
3. 启动prometheus
- 重新启动
FIRING就是altermanager已经触发了告警.# 后面还有很多需要改prometheus配置文件的,为了不一直重启,启动prometheus用热加载配置文件的方式
# 启动时加上--web.enable-lifecycle启用远程热加载配置文件,调用指令是curl -X POST http://localhost:9090/-/reload
docker run -d --restart=always --name prometheus -p 9090:9090 -v /data/prometheus/conf/prometheus.yml:/etc/prometheus/prometheus.yml -v /data/prometheus/conf/prom:/etc/prometheus/prom -v /data/prometheus/data:/prometheus prom/prometheus  --config.file=/etc/prometheus/prometheus.yml --storage.tsdb.path=/prometheus --web.console.libraries=/usr/share/prometheus/console_libraries --web.console.templates=/usr/share/prometheus/consoles --web.external-url=http://124.71.81.11:9090
八. prometheus表达式
1. 数据类型
- metrices常用数据种类分为:
1. Gauges
- gauges是没有规律的数据,采集回来多少就是多少.例如CPU的采集
2. Counters
- Counters就是计数器,从数据量0开始计算,在理想状态下,只能永远的增长,不会降低,比如用户访问量(PV和UV
3. Histograms和Summary
分位数
- Histograms是同级数据的分布情况,比如最小值,最大值,中位数,75百分位,90百分位(百分比的数据,Histograms近似百分比估算值)
- 最难理解的类型,但是比较常用
- Histogram和Summary数据类型主用用于统计和分析样本的分布情况, summary 和 histogram 可以来计算 φ-分位数
# HELP prometheus_tsdb_wal_fsync_duration_seconds Duration of WAL fsync.
# TYPE prometheus_tsdb_wal_fsync_duration_seconds summary

prometheus_tsdb_wal_fsync_duration_seconds{quantile="0.5"} 0.012352463

prometheus_tsdb_wal_fsync_duration_seconds{quantile="0.9"} 0.014458005

prometheus_tsdb_wal_fsync_duration_seconds{quantile="0.99"} 0.017316173

prometheus_tsdb_wal_fsync_duration_seconds_sum 2.888716127000002

prometheus_tsdb_wal_fsync_duration_seconds_count 216

# 从上面的样本中可以得知当前Prometheus Server进行wal_fsync操作的总次数为216次,耗时2.888716127000002s,其中中位数(quantile=0.5)的耗时为0.012352463,9分位数(quantile=0.9)的耗时为0.014458005s。
2. 表达式类型
-
prometheus查询语句叫做表达式,运用大量数学运算,简单的四则运算,难的微积分,代数,求导等
-
任何表达式或者子表达式都可以归为四种类型:
instant vector瞬时向量 , 一组时间序列,包含每个时间序列的单个样本,所有时间序列都共享相同的时间戳range vector范围向量,一组时间序列,包含每个时间序列随时间变化的一系列数据点scalar标量,一个简单的浮点值string字符串, 一个当前没有被使用的简单字符串
3. 运算符号
+(加)-(减)*(乘)/(除)%(取余)^(乘方)==(等于)!=(不等于)>(大于)<(小于)>=(大于等于)<=(小于等于)and(交集)or(并集)unless(补集)sum:(计算总和)min:(选择最小值)max:(选择最大值)avg:(计算平均值)stddev:(计算总体标准偏差)stdvar:(计算总体标准方差)count:(计算向量中元素的数量)count_values:(计算具有相同值的元素的数量)bottomk:(k个最小的采样值)topk:(k个最大的采样值)quantile:计算 φ-quantile (0 ≤ φ ≤ 1)without: 用于从计算结果中移除匹配到的的标签- without (cpu)
offset: 偏移量,查询当前时间点之前的数据offset 5m
by: 只显示匹配到的标签by (name)
九. Prometheus函数
参考
- 整个prometheus难点就是
PromQL - 以下是常用的函数
1. increase()
- increase函数是聚合方法,在Prometheus是用来针对Counter这种持续增长的metrices数据,截取其中一段时间的增量,
- 例如
// 这样就截取了CPU总使用时间在1分钟内的增量
increase(node_cpu[1m])
2. sum()
-
使用频率很频繁,求和的意思
-
例如
// 所有节点1分钟CPU增量的和
sum(increase(node_cpu[1m]))
- sum() by (cluster_name)可以帮我们实现集群加合并分几条曲线输出的.
- 比如有几千台服务器,按照sum() by (instance)按照每台服务器出一条线,还是挺多的,按照集群数量就少很多便于出图
- (cluster_name)这个标签,默认是node_exporter是没有办法提供的.
3. by (instance)
-
生产上肯定是多台服务器的监控,如果用sum就会把所有的服务器的CPU值全部加到一起,就变成服务器集群总CPU平均值了.这样的监控毫无意义,于是就引出了by (instance)
-
注意by后面有个空格,这个函数可以把sum加合到一起的数数值,按照指定的一个方式进行一层的拆分,instance代表的是机器名.
// 每台服务器的1分钟空闲CPU的增量的和
sum(increase(node_cpu{mode="idle"}[1m])) by (instance)

// 每台服务用户态CPU的使用时间
sum(increase(node_cpu{mode="user"}[1m])) by (instance)

// 内核态
sum(increase(node_cpu{mode="system"}[1m])) by (instance)

// io等待
sum(increase(node_cpu{mode="iowait"}[1m])) by (instance)

// 每台服务器1分钟CPU增量的和
sum(increase(node_cpu[1m])) by (instance)

// 有了上面2个值,那么就可以进行计算了,空闲的除以使用的.就得到空闲的百分比了
sum(increase(node_cpu{mode="idle"}[1m])) by (instance) / sum(increase(node_cpu[1m])) by (instance)

// 要得到CPU使用的百分比
(1 - (sum(increase(node_cpu{mode="idle"}[1m])) by (instance) / sum(increase(node_cpu[1m])) by (instance))) * 100
4. rate()
- rate函数可以说是Prometheus提供的最重要的函数之一
- 和
irate()类似 - rete函数是专门搭配counter类型数据使用的函数(也就是说rate的小括号内必须是counter类型的metrices),他的功能是按照设置一个时间段,取counter在这个段中的平均每秒的增量.
- 遇到counter类型的metrices,别的先不做,先给他套上rate或者increase函数.
// rate()函数经常用到的是采集1s钟的数据,比如流量,CPU,free,IO等.这种rate()好用,几分钟采集一次的increase()比较好用.
rate(node_network_receive)bytes[1m])

// 比如rate(1m)取流量,1分钟内增加的量除以秒数,就是1秒钟的增量和rate(5m)取流量,5分钟内增加的量除以秒数,就是1秒钟的增量,比如都是每秒钟16的增量,但是出图却不一样,这是什么原因呢

// rate()和increase()区别是rate会除以秒数,而increase取的是增量.他们两个的用法比较相似.
rate(node_network_receive)bytes[1m])

increase(node_network_receive)bytes[1m])
5. topk()
- 取前几位的最高值,既可以针对Gauge又可以针对Counter类型的数据.
// 比如count_netstat_wait_connections取出来有几十个数据,前面加个3就表示取前3个的数据.
topk(3,count_netstat_wait_connections)
6. count()
- 把数值符合条件的,输出数目进行加合(和数据库的count一样的)
// 出当前(或者历史)TCP 等待数大于200的机器数量
count(count_netstat_wait_connections > 200)
7. floor()
- 将
float转为int
# 得到百分比一般都会有小数点很多位数,利用这个函数可以得到整数
floor(sum(container_memory_rss{image!=""}) by(name, instance)  / sum(container_spec_memory_limit_bytes{image!=""}) by(name, instance) * 100 != +inf) > 80
8. time()
- 输出时间戳
9. max() min()
- 最大和最小
10 on(instance)
- 就只会找都有instance标签并且instance的值相同的条目进行计算
11. histogram_quantile
12. group
十. 常用PromQL
1. node_exporter
- 每个版本的node_exporter有些的指标不一样,具体看官网指标含义
# 内存使用率
100 - (node_memory_MemFree_bytes + node_memory_Cached_bytes + node_memory_Buffers_bytes) / node_memory_MemTotal_bytes*100 > 80
# 这个也是内存使用
(1 - (node_memory_MemAvailable_bytes{job="node"} / (node_memory_MemTotal_bytes{job=~"node"})))* 100 > 80

# 分区使用率
max(100 - (node_filesystem_free_bytes{fstype=~"xfs|ext4"} / node_filesystem_size_bytes{fstype=~"xfs|ext4"} * 100)) by(instance,mountpoint) > 80

# CPU使用率
(1 - (sum(increase(node_cpu_seconds_total{mode="idle"}[1m])) by (instance) / sum(increase(node_cpu_seconds_total[1m])) by (instance))) * 100 > 80

# 分区使用率
max((node_filesystem_size_bytes{job="node",fstype=~"ext.?|xfs"} - node_filesystem_free_bytes{job="node",fstype=~"ext.?|xfs"}) * 100 / (node_filesystem_avail_bytes {job="node",fstype=~"ext.?|xfs"} + (node_filesystem_size_bytes{job="node",fstype=~"ext.?|xfs"} - node_filesystem_free_bytes{job="node",fstype=~"ext.?|xfs"}))) by(instance,mountpoint) > 80

# 服务器down机
up == 0

# 前5分钟的负载大于CPU核心数的2倍,说明负载高了
node_load5 > on(instance) 2 * count(node_cpu_seconds_total{mode="idle"}) by (instance)

# 出当前(或者历史)TCP 5分钟内等待数大于200的机器数量
count(count_netstat_wait_connections[5m] < 200)

# prometheus的http请求数不是200和302的,5分钟前的值,offset表示前移多少时间
sum(prometheus_http_requests_total{code!~"200|302"} offset 5m)

# eth0网卡在范围向量为1小时的范围每秒收到(下载)的流量是多少kb
sum(rate(node_network_receive_bytes_total{device="eth0"}[60m])) / 1024

# 选中的节点eth0网卡在范围向量为1小时的范围每秒发送(上传)的流量是多少kb,可以自己扩展
sum(rate(node_network_transmit_bytes_total{device="eth0"}[60m])) / 1024

# 显示每个节点一小时下载的流量是多少M
increase(node_network_receive_bytes_total[60m]) / 1024^2

# 显示每个节点的已经建立的TCP连接,可以在服务器上输入看netstat |grep -i 'estab'
node_netstat_Tcp_CurrEstab{job="node"}

# TCP连接的TIMEWAIT,这个阈值根据自己设置可以看内核文件,TCP状态基本和这些类似
node_sockstat_TCP_tw > 4900

# 已使用的文件打开数大于50000的,ulimit -n可以看到设定的值
node_filefd_allocated > 50000

# prometheus查询相应时间,这里使用的quantile,也叫分位数,利用的是prometheus的histogram_quantile函数
prometheus_engine_query_duration_seconds

prometheus_engine_query_duration_seconds{quantile="0.5",slice="queue_time"} > 2
prometheus_engine_query_duration_seconds{quantile="0.9",slice="queue_time"}
prometheus_engine_query_duration_seconds{quantile="0.99",slice="queue_time"}

# prometheus请求延时时间,单位秒
histogram_quantile(0.5, sum(rate(prometheus_http_request_duration_seconds_bucket[5m])) by (le, handler)) > 2

# 0.9分位数(prometheus只取0到1,所以是百分之90的查询时间,单位是秒),prometheus内部测评查询时间(监控是否是慢查询),同样0.5, 0.99是一样的
sum(prometheus_engine_query_duration_seconds{quantile="0.9",slice="inner_eval"}) by (job,instance) > 1
2. docker
# 容器cpu使用超过80%
sum(rate(container_cpu_usage_seconds_total{image!=""}[1m])) by (name,instance) / (sum(container_spec_cpu_period{image!=""} / 100000) by (name,instance)) * 100 > 80

# 容器内存使用超过80%,在监控内存前一定要给容器设置内存limit,为了得到使用的百分比,k8s也同样适用,docker热设置limit命令: docker update -m 1024M ${container_name}
sum(container_memory_rss{image!=""}) by(name, instance) / sum(container_spec_memory_limit_bytes{image!=""}) by(name, instance) * 100 != +inf > 80

# 容器文件使用量,阈值界定不好搞
sum(container_fs_usage_bytes{image!=""}) by(name, instance) / 1024^2
3. jvm
# 10分钟jvm加载的类数量
sum(rate(jvm_classes_loaded_total[10m])) by (instance)

# 死锁的线程数量,新建的线程:NEW,等待的线程:WAITING等都是一样的
sum(jvm_threads_state{state="BLOCKED"}) by (instance)

# 这个也是死锁的线程数量,gauages类型
max(jvm_threads_deadlocked) by (instance)

# 内存池Code Cache(代码缓存区)使用多少M,其他的也是一样的
sum(jvm_memory_pool_bytes_used{pool="Code Cache"}) by (instance, pool) / 1024^2

# 内存池Compressed Class Space(指针指向的空间)使用
sum(jvm_memory_pool_bytes_used{pool="Compressed Class Space"}) by (instance, pool) / 1024^2

# Metaspace,元空间
sum(jvm_memory_pool_bytes_used{pool="Metaspace"}) by (instance, pool) / 1024^2

# PS Eden Space(新生代,对象被创建的时候首先放到这个区域)
sum(jvm_memory_pool_bytes_used{pool="PS Eden Space"}) by (instance, pool) / 1024^2

# PS Old Gen(老年代,存放新生代中经过多次垃圾回收仍然存活的对象)
sum(jvm_memory_pool_bytes_used{pool="PS Old Gen"}) by (instance, pool) / 1024^2

# PS Survivor Space(幸存者区,不能被回收的对象存放的位置)
sum(jvm_memory_pool_bytes_used{pool="PS Survivor Space"}) by (instance, pool) / 1024^2

# 1m的GC消耗的时间
sum(rate(jvm_gc_collection_seconds_count{gc="PS Scavenge"}[1m])) by (instance, gc)

# 1m标记的时间
sum(rate(jvm_gc_collection_seconds_count{gc="PS MarkSweep"}[1m])) by (instance, gc)

# 给定的jvm内存,gauages类型,
jvm_memory_pool_bytes_max

# 上一次GC内存池的大小
jvm_memory_pool_collection_committed_bytes / 1024 ^ 2

# JVM内存池最后一次垃圾回收使用的字节数
jvm_memory_pool_collection_used_bytes / 1024 ^ 2

# 10分钟卸载的类数量
rate(jvm_classes_unloaded_total[10m])
十一. 容器监控
- cadvisor监控docker中的容器
1. cadvisor
docker run --restart=always \
  -v /:/rootfs:ro -v /var/run:/var/run:rw \
  -v /sys:/sys:ro \
  -v /var/lib/docker/:/var/lib/docker:ro \
  -v /dev/disk/:/dev/disk:ro \
  -p 7890:8080 -d \
  --name=cadvisor \
  google/cadvisor:latest
# 创建并编写docker的rule
vim /data/prometheus/conf/docker-rule.yml
groups:
- name: docker
  rules:
  - alert: Container_CPU_High
    expr: sum(rate(container_cpu_usage_seconds_total{image!=""}[1m])) by (name) / (sum(container_spec_cpu_period{image!=""} / 100000) by (name)) * 100 > 80
    for: 5m
    labels:
      status: Critical
    annotations:
      summary: "Container {{ $labels.name }} In {{ $labels.instance }}: High CPU usage"
      description: "Container {{ $labels.name }} In {{ $labels.instance }} of job {{ $labels.job }} CPU usage is {{ $value }}"

  - alert: Container_Free_High
    expr: sum(container_memory_rss{image!=""}) by(name) / sum(container_spec_memory_limit_bytes{image!=""}) by(name) * 100 != +inf > 80
    for: 5m
    labels:
      status: Critical
    annotations:
      summary: "Container {{ $labels.name }} In {{ $labels.instance }}: High Free usage"
      description: "Container {{ $labels.name }} In {{ $labels.instance }} of job {{ $labels.job }} Free usage is {{ $value }}"
2. 常用指标
| 指标 | 说明 | 单位 |
|---|---|---|
| container_memory_max_usage_bytes | 容器中最大使用的内存的记录 | bytes |
| container_memory_usage_bytes | 容器中当前是用的内存 | bytes |
| container_spec_cpu_period | cpu的配额,相当于cpu的limit | CPU个数 * 100000 = cpu配额 |
| container_cpu_usage_seconds_total | 容器当前使用的cpu | bytes |
| container_memory_rss | RSS内存,常驻内存集.分配给进程使用实际物理内存 | bytes |
| container_spec_memory_limit_bytes | 设置的内存的limit | bytes |
十二. pushgateway
1. 数据走向
- 通过使用
pushgateway来实现自定义监控- 自己写的脚本通过
pushgateway插件来
- 自己写的脚本通过
# docker安装,pushgateway随便在哪里构建都可以,也可以做集群化
docker run --restart=always --name pushgateway -d -p 9091:9091 prom/pushgateway
- web页面查看
[外链图片转存失败,源站可能有防盗链机制,建议将图片保存下来直接上传(img-MkC3ZVbw-1633345453690)(images/image-20210816145335773.png)]
- 测试给pushgateway一条数据,当然这个数据是我们通过脚本去获取,最终还是指向了脚本
echo 'ech 404' | curl --data-binary @- http://124.71.81.11:9091/metrics/job/pushgateway/ip/192.168.0.212
- 这条数据的意思就是设置一个KEY为ech,他的value为404(类似监控我们的api)
--data-binary @-: 意思为携带二进制数据发送POST请求,pushgateway只支持POST- 然后接上
pushgateway的URL: http://124.71.81.11:9091/metrics/ - 后面的
job和ip是自己设置,相当于给这条自定义的数据标签,方便PromQL查询到job对应是pushgatewayip对应的是192.168.0.212
- 最后再看我们Metric页面
[外链图片转存失败,源站可能有防盗链机制,建议将图片保存下来直接上传(img-zve77Isf-1633345453691)(images/image-20210816151948529.png)]
- 最后在prometheus的Graph界面输入自定义的指标可以获得数据,也就可以通过PromQL让altermanager去发送告警
[外链图片转存失败,源站可能有防盗链机制,建议将图片保存下来直接上传(img-VvjQPwQz-1633345453692)(images/image-20210816151836388.png)]
2. 案例
1. shell
- shell实现就是脚本然后
curl,过程略
# shell脚本结合crontab定时执行给pushgateway数据即可
echo 'ech 404' | curl --data-binary @- http://124.71.81.11:9091/metrics/job/pushgateway/ip/192.168.0.212
2. python
- 下载模块
pip3 install flask
pip3 install prometheus_client
pip3 install requests
- 监控一些接口的状态
import requests
import prometheus_client
from prometheus_client import Counter
from prometheus_client.core import CollectorRegistry
from flask import Response, Flask
十三. blackbox_exporter
blackbox exporter利用端口探测是方式实现监控服务端口- 可以对
SSL证书过期时间监测 - 可以提供 http, dns, tcp, icmp 的监控数据采集
- 正如他的名字,还可以用来测试等等功能
1. 端口监控
1. 配置文件
# 编写blackbox_exporter配置文件,固定格式,直接复制就可以
vim /data/blackbox_exporter/blackbox.yml

modules:
  http_2xx:
    prober: http
  http_post_2xx:
    prober: http
    http:
      method: POST
  tcp_connect:
    prober: tcp
  pop3s_banner:
    prober: tcp
    tcp:
      query_response:
      - expect: "^+OK"
      tls: true
      tls_config:
        insecure_skip_verify: false
  ssh_banner:
    prober: tcp
    tcp:
      query_response:
      - expect: "^SSH-2.0-"
  irc_banner:
    prober: tcp
    tcp:
      query_response:
      - send: "NICK prober"
      - send: "USER prober prober prober :prober"
      - expect: "PING :([^ ]+)"
        send: "PONG ${1}"
      - expect: "^:[^ ]+ 001"
  icmp:
    prober: icmp
- 启动
blackbox_exporter
# 随便找台服务器启动都可以,只要网络是通的
docker run --restart=always -d -p 9115:9115 --name blackbox_exporter -v /data/blackbox_exporter/blackbox.yml:/config/blackbox.yml prom/blackbox-exporter --config.file=/config/blackbox.yml
# prometheus.yml增加监控port的job,监控业务端口是否正常
- job_name: 'port_status'
    scrape_interval: 30s
    metrics_path: /probe
    params:
      module: [tcp_connect]
    file_sd_configs:
      - files:
        - prom/targets/port-target.yaml
        refresh_interval: 2m
    relabel_configs:
      - source_labels: [__address__]
        target_label: __param_target
      - source_labels: [__param_target]
        target_label: instance
      - target_label: __address__
        replacement: 192.168.0.212:9115		# blackbox_exporter所在的位置
- 原理
# 看192.168.0.212:3000的端口是否正常,我们curl一下,最后一行的probe_success显示为1就表示正常,0就与之相反,有些我看也有是0,个人觉得不准确
curl http://192.168.0.212:9115/probe?target=192.168.0.212:3000&module=tcp_connect&debug=true
- 准确的看
blackbox_exporter的Logs
[外链图片转存失败,源站可能有防盗链机制,建议将图片保存下来直接上传(img-0ijfHjTS-1633345453692)(images/image-20210820135521485.png)]
2. 告警
- 端口已经监控了,接着就是对监控的进行告警配置的编写
# 监控端口
probe_success{job="port_status"} == 0
2. SSL监控
1. 配置文件
  - job_name: 'ssl'
    metrics_path: /probe
    params:
      module: [http_2xx]
    file_sd_configs:
      - files:
        - prom/targets/ssl-target.yaml
        refresh_interval: 2m
    relabel_configs:
      - source_labels: [__address__]
        target_label: __param_target
      - source_labels: [__param_target]
        target_label: instance
      - target_label: __address__
        replacement: 192.168.0.212:9115
2. 告警
# 小于30天的证书告警
floor((probe_ssl_earliest_cert_expiry - time()) / 86400 < 30)
3. grafana出图
grafana直接出图是不对的,显示会有问题,因为不管是端口列表或者域名列表,他们的标签都是一样的,没法区分,自己写promQL出图
十四. 服务发现
1. 简介
- 通过定义
job_name定义,如果节点发生变化,比如新增节点,那我们就不得不编辑prometheus.yml配置文件, 适用静态的static_configs去管理节点,并重载prometheus配置才能完成,这些都需要手动去进行,很显然,会疲于奔命, 特别是容器环境中,根本就没法适用. - prometheus服务发现机制
Service Discovery,其实就是prometheus的注册中心,简称**:SD**, 不需要用户静态的配置static_configs- SD的机制
- 每一个服务在启动时会将自己注册到注册中心上,而且会周期性的去更新自己的注册信息,如果不更新了,注册中心就会将那些过期的注册条目删除,从而Prometheus也就会知道这个Target离线了,然后Prometheus也会将这个Target从自己的监控系统中移除
- SD的机制
2. 服务发现
- Prometheus可以集成到多种多种不同的开源服务发现工具上,动态发现需要监控的目标,如
Consul,Eureka,Zookeeper,Serverset或Airbnb Nerve等,同时Prometheus也可以很好的集成到目前主流的Kubernetes容器编排平台上,通过其API Server动态发现各类被监控的对象,如Pod、Server、Endpoint、Ingress和Node对象,同时Prometheus基于DNS或者文件的动态发现机制
3. 基于文件服务发现
- 基于文件的服务发现是仅仅略优于静态配置的服务发现的方式,它不依赖于任何平台或第三方服务,因而也是最为简单和通用的实现方式,Prometheus Server可以定期从指定文件中加载Target信息
- 支持json和yaml格式,例如先创建一个prom_port_sd.yaml
# 先创建一个yaml,里面有2组列表
vim prom_port_sd.yaml

- targets:
  - 192.168.0.31:6378
  - 192.168.0.31:5672
  - 192.168.0.31:15672
  - 192.168.0.31:9093
  - 192.168.0.31:9092
  - 192.168.0.31:28017
  - 192.168.0.31:9201
  - 192.168.0.31:5602
  - 192.168.0.31:2181
  - 192.168.0.31:2182
  labels:
    app: prometheus
    job: prometheus

- targets:
  - node1.cce.com:9100
  - node2.cce.com:9100
  labels:
    app: node-expoter
    job: node
- 然后再prometheus的主配置文件中引用到创建的文件
global:
  scrape_interval: 15s
  evaluation_interval: 15s

alerting:
  alertmanagers:
  - static_configs:
    - target:

rule_files:
  - "prom/rules/*-rule.yml"

scrape_configs:
  - job_name: 'prometheus'
    file_sd_configs:				# 服务发现动态感知target的关键字
    - files:
      - targets/prom*.yaml 			# 指定要加载的文件列表,支持通配符
      refresh_interval: 2m 			# 每隔2分钟重新加载一次文件中定义的Target,默认为5m
4. 基于k8s api-server
5. 基于consul
十五. prometheus集群
prometheus虽然不支持集群,但还是难不倒苦逼运维,上面所做的一切都是针对小微环境构建的,我们最终通过consul做SD,高可用prometheus实现中大型企业级监控prometheus采集的数据默认只保存15天,如果要对监控的数据做分析,需要持久化prometheus集群架构图
[外链图片转存失败,源站可能有防盗链机制,建议将图片保存下来直接上传(img-nmwee7D2-1633345453693)(images/image-20210820162605311.png)]
(一). 服务发现
1. consul搭建
docker pull consul
docker run --restart=always --name consul -d -p 8500:8500 consul

# 然后浏览器访问${IP}:${PORT}
2. 注册到consul
# 测试注册,修改为自己的IP和Port
curl -X PUT -d '{"id": "node-exporter","name": "node-exporter","address": "192.168.0.212","port": 9100,"tags": ["test"],"checks": [{"http": "http://192.168.0.212:9100/metrics", "interval": "5s"}]}'  http://192.168.0.212:8500/v1/agent/service/register


# 删除已经注册的信息
curl -X PUT http://192.168.0.212:8500/v1/agent/service/deregister/node-exporter
- 查看是否测试成功
3. prometheus服务发现
- 在prometheus配置文件中配置consul做SD
  - job_name: 'consul-prometheus'
    consul_sd_configs:
    - server: '192.168.0.212:8500'
      services: []
- 通过
relabel_configs来解决一些标签等的问题 - 然后只需要将我们的搜集体各种
exporter注册到consul上去
(二). prometheus集群
1. altermanger集群
- 使用两个
Prometheus主机监控同样的目标,然后有告警出现,也会发送同样的告警给Alertmanager,然后使用Alertmanager自身的去重告警功能,只发出一条告警出来,然后用keepalived做双机热备alertmanager0.15.2以上才能实现集群, 多个Altermanager组成gossip集群
# 启动altermanager加2个参数就可以配置集群,具体可以--help

# 你altermanager的ip和端口
--cluster.listen-address=""

# 集群中有哪些altermanager,自己的也要写上
--cluster.peer=CLUSTER.PEER

# 比如gossip集群的IP各自为192.168.0.2:9094,192.168.0.3:9094,192.168.0.4:9094,
# alter1 启动配置为--cluster.listen-address=192.168.0.2:9094 --cluster.peer=192.168.0.2:9094 --cluster.peer=192.168.0.3:9094 --cluster.peer=192.168.0.4:9094,alter2只需要改--cluster.listen-address

# 同时prometheus配置文件中需要都添加上
2. Federation
-
prometheus不支持集群的配置,但是支持
Federation也叫联邦,允许Prometheus服务器从另一个Prometheus服务器抓取选定的时间序列,联邦有不同的用例。通常,它用于实现可扩展的 Prometheus 监控设置或将相关指标从一个服务的 Prometheus 提取到另一个服务中 -
小集群用联邦是没问题的,如果集群过大,联邦就会造成
Top Prometheus的压力过大,因为所有的数据都汇集到Top Prometheus中
1. 配置
十六. thanos方案
Thanos
-
使用灭霸做prometheus的高可用,
Thanosis a CNCF Incubating project, Thanos是一系列组件 -
Thanos是一款开源的Prometheus 高可用解决方案,其支持从多个Prometheus中查询数据并进行汇总和去重,并支持将Prometheus本地数据传送到云上对象存储进行长期存储
-
去掉了top Prometheus
[外链图片转存失败,源站可能有防盗链机制,建议将图片保存下来直接上传(img-czTznKah-1633345453695)(images/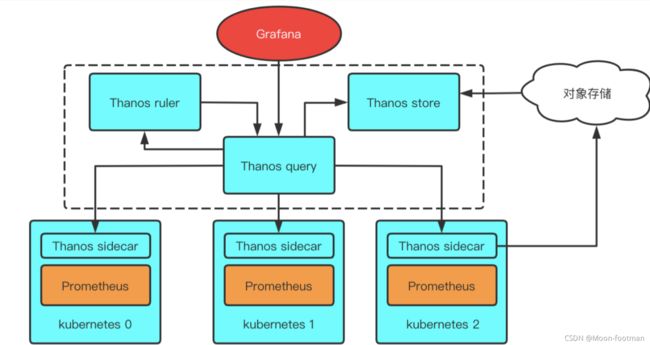
1. 核心组件
1. sidecar
- 边车,和prometheus server运行在一起,互不影响, 相当于流量全部经过这个边车,然后进入prometheus server来处理, Sidecar可以视为一个Proxy组件,所有对Prometheus的访问都通过Sidecar来代理进行。通过Sidecar还可以将采集到的数据直接备份到云端对象存储服务器
2. store gateway
- Store gateway实现了一套和Sidecar完全一致的API提供给Querier用于查询Sidecar备份到云端对象存储的数据。因为Sidecar在完成数据备份后,Prometheus会清理掉本地数据保证本地空间可用。所以当监控人员需要调取历史数据时只能去对象存储空间获取,而Store就提供了这样一个接口。Store Gateway内部还做了一些加速数据获取的优化逻辑,一是缓存了 TSDB 索引,二是优化了对象存储的远程调用请求 (用尽可能少的请求量拿到所有需要的数据
3. query
- Querier从Sidecar和Store gateway获取指标数据,同时Querier实现了一套Prometheus官方的HTTP API从而保证对外提供与Prometheus一致的数据源接口,Grafana可以通过同一个查询接口请求不同集群的数据,Querier负责找到对应的集群并通过Sidecar获取数据,也能从Store gateway获取指标数据。Querier本身也是无状态的、可水平可扩展的,因而可以实现高可部署。Querier可以实现对高可部署的Prometheus的数据进行合并从而保证多次查询结果的一致性,从而解决全局视图和Prometheus高可用的问题
4. ruler
- 对监控数据进行评估和告警,还可以计算出新的监控数据,将这些新指标数据提供给 Thanos Query 查询,上传指标数据到对象存储,以供长期存储
5. compactor
- 通常在查看较大时间范围的监控数据时,很多时候并不需要那么详细的数据,更多时候是为了得到数据趋势。compactor读取对象存储的数据,对其进行压缩以及降采样后再上传到对象存储,在查询大时间范围数据时就只读取压缩和降采样后的数据,极大地减少了查询的数据量,从而加速查询
十七. 注意点
1. promql慢查询
- 如果时间比较长就是慢查询
- 一般情况下响应过慢查询都是 promql 使用不当导致,或者指标规划不正当,比如大量使用 join 来组合指标或者增加 label
[外链图片转存失败,源站可能有防盗链机制,建议将图片保存下来直接上传(img-CeFSYjWA-1633345453696)(images/image-20210909155728667.png)]
十八. 监控JVM
- jvm监控有两种方式
- 一种是启动java启动一个agent,这一种是运维直接可以操作,在作镜像的加入agent
- 另一种是在Java中配置好OPTS参数,暴露端口,这种是需要开发配合做,暴露响应的端口
参考
1. 下载agent的jar包
- 采用的是 java agent的方式
wget https://repo1.maven.org/maven2/io/prometheus/jmx/jmx_prometheus_javaagent/0.16.1/jmx_prometheus_javaagent-0.16.1.jar
2. yaml参数
| Name | Description |
|---|---|
| startDelaySeconds | 在服务请求之前开始延迟。延迟期内的任何请求都将导致指标集为空。 |
| hostPort | 要通过远程 JMX 连接的主机和端口。如果既未指定 this 也未指定 jmxUrl,则将与本地 JVM 对话。 |
| username | 用于远程 JMX 密码认证的用户名。 |
| password | 用于远程 JMX 密码认证的密码。 |
| jmxUrl | 要连接到的完整 JMX URL。如果是 hostPort,则不应指定 |
| ssl | JMX 连接是否应该通过 SSL 完成。要配置证书,您必须设置以下系统属性:-Djavax.net.ssl.keyStore=/home/user/.keystore-Djavax.net.ssl.keyStorePassword=changeit-Djavax.net.ssl.trustStore=/home/user/.truststore-Djavax.net.ssl.trustStorePassword=changeit |
| lowercaseOutputName | 小写输出指标名称。适用于默认格式和name. 默认为假。 |
| lowercaseOutputLabelNames | 小写输出指标标签名称。适用于默认格式和labels. 默认为假。 |
| whitelistObjectNames | 要查询的ObjectName列表。默认为所有 mBean。 |
| blacklistObjectNames | 不查询的ObjectName列表。优先于whitelistObjectNames。默认为无。 |
| rules | 要按顺序应用的规则列表,处理在第一个匹配规则处停止。不收集不匹配的属性。如果未指定,则默认以默认格式收集所有内容。 |
| pattern | 匹配每个 bean 属性的正则表达式模式。 该模式未锚定。 捕获组可用于其他选项。 默认匹配所有内容。 |
| attrNameSnakeCase | 将属性名称转换为蛇形大小写。这可以从与模式和默认格式匹配的名称中看出。例如,anAttrName 到 an_attr_name。默认为假。 |
| name | The metric name to set. Capture groups from the pattern can be used. If not specified, the default format will be used. If it evaluates to empty, processing of this attribute stops with no output. |
| value | Value for the metric. Static values and capture groups from the pattern can be used. If not specified the scraped mBean value will be used. |
| valueFactor | Optional number that value (or the scraped mBean value if value is not specified) is multiplied by, mainly used to convert mBean values from milliseconds to seconds. |
| labels | A map of label name to label value pairs. Capture groups from pattern can be used in each. name must be set to use this. Empty names and values are ignored. If not specified and the default format is not being used, no labels are set. |
| help | Help text for the metric. Capture groups from pattern can be used. name must be set to use this. Defaults to the mBean attribute description and the full name of the attribute. |
| cache | Whether to cache bean name expressions to rule computation (match and mismatch). Not recommended for rules matching on bean value, as only the value from the first scrape will be cached and re-used. This can increase performance when collecting a lot of mbeans. Defaults to false. |
| type | The type of the metric, can be GAUGE, COUNTER or UNTYPED. name must be set to use this. Defaults to UNTYPED. |
3. 启动
- 启动前先编写配置文件
vim prometheus-jmx-config.yaml
---
lowercaseOutputLabelNames: true
lowercaseOutputName: true
whitelistObjectNames: ["java.lang:type=OperatingSystem"]
rules:
 - pattern: 'java.lang<>((?!process_cpu_time)\w+):'
   name: os_$1
   type: GAUGE
   attrNameSnakeCase: true
- 指定agent端口,自己指定
/data/prometheus/package目录是放prometheus-jmx-config.yaml和jmx_prometheus_javaagent-0.16.1.jar的
docker run -d \
  --name tomcat-1 \
  -v /data/prometheus/package:/jmx-exporter \
  -e CATALINA_OPTS="-Xms64m -Xmx128m -javaagent:/jmx-exporter/jmx_prometheus_javaagent-0.16.1.jar=6060:/jmx-exporter/prometheus-jmx-config.yaml" \
  -p 6060:6060 \
  -p 8080:8080 \
  tomcat:8.5-alpine