matplotlib简介
面向对象作图
#2019.8.6mrc for rmsd,目前只有RMSD作图的功能
import matplotlib.pyplot as plt
import numpy as np
class draw():
def __init__(self):
pass
def drawrmsd(self,filelist=[]):
#user-defined:color,linewidth,linestyle,marker
self.color = ['k','r','b','y','g','c','m','w']
self.linewidth = ['0.5','1','2','2','2','2','2','2']
self.linestyle = [':','-','--','-.',':','-','-','-']
self.marker = ['.','None','v','.','+','*','','']
self.filelist = filelist
self.y = ["y"+str(i) for i in range(1,10)]
self.x = ["x"+str(i) for i in range(1,10)]
num = 0
num2 = 0
for filename in self.filelist:
self.y[num] = np.loadtxt(filename)
self.x[num] = list(range(1,len(self.y[num])+1))
plt.plot(self.x[num],self.y[num],label=filename.split('.')[0],color=self.color[num],linewidth=self.linewidth[num],linestyle=self.linestyle[num],marker=self.marker[num])
print (filename,self.color[num],self.linewidth[num],self.linestyle[num],self.marker[num])
#define num2 for xlim and xticks
if len(self.y[num]) > num2:
num2 = len(self.y[num])
num += 1
plt.xlim((0,num2+1))
#user-defined,change the number behind 'num2' and the range value to set up the x axis label
plt.xticks(np.linspace(1,num2,11),[str(i)+'ns' for i in range(100,201,10)],fontsize=9)
plt.xlabel('Time(ns)',fontsize=13)
plt.ylabel('rmsd(Ans.)',fontsize=13)
plt.title('RMSD show',fontsize=15)
plt.legend()
plt.show()
if __name__ == '__main__':
draw_task1 = draw()
draw_task1.drawrmsd(['backbone_rmsd.dat','cla_rmsd.dat','bcr_rmsd.dat'])
基础
1,认识
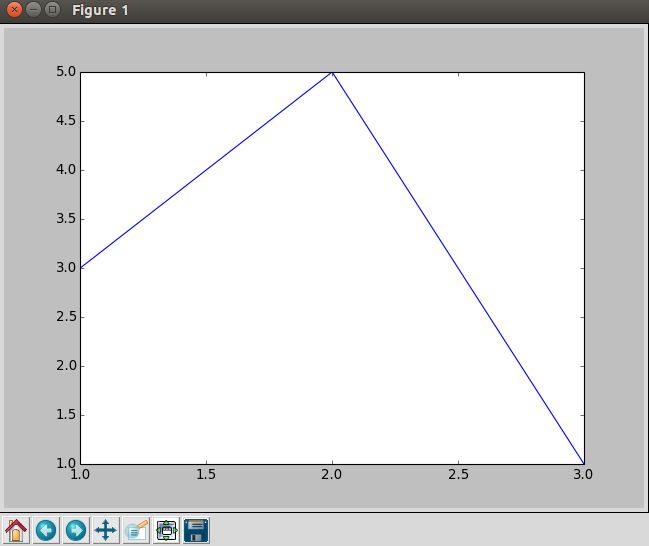
import matplotlib.pyplot as plt
plt.plot([1,2,3],[3,5,1])
plt.show()
2、图例、标签和标题
import matplotlib.pyplot as plt
x = [1,2,3]
y = [5,7,4]
x2 = [1,2,3]
y2 = [10,14,12]
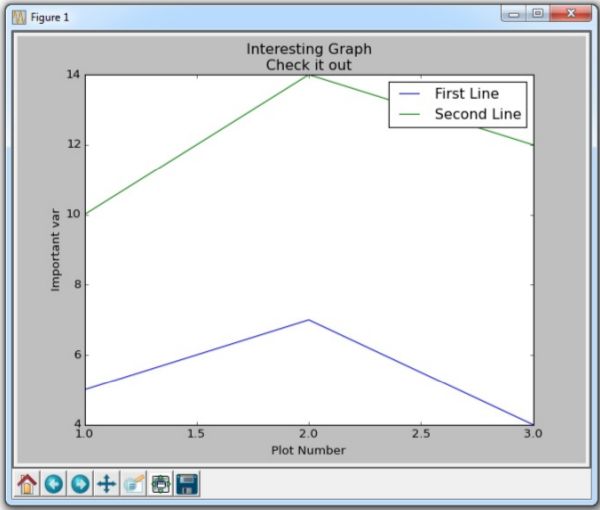
plt.plot(x, y, label='First Line') #label是指定线条名字,可以在后面用legend显示它
plt.plot(x2, y2, label='Second Line')
plt.xlabel('Plot Number')
plt.ylabel('Important var')
plt.title('Interesting Graph\nCheck it out')
plt.legend() #显示标签
plt.show()
3、条形图和直方图
(1)条形图
import matplotlib.pyplot as plt
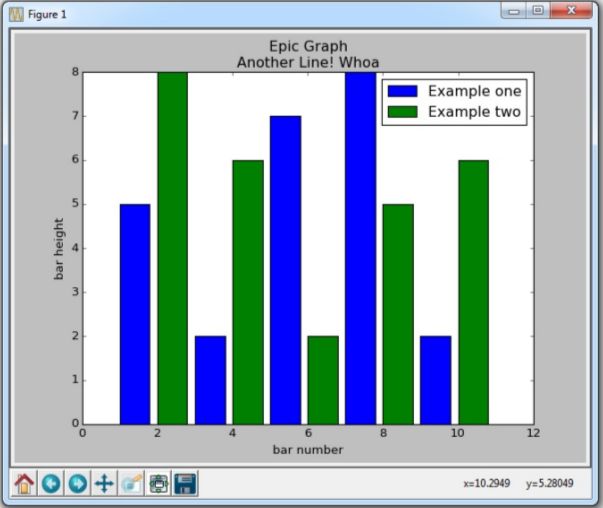
plt.bar([1,3,5,7,9],[5,2,7,8,2], label="Example one")
plt.bar([2,4,6,8,10],[8,6,2,5,6], label="Example two", color='g')
plt.legend()
plt.xlabel('bar number')
plt.ylabel('bar height')
plt.title('Epic Graph\nAnother Line! Whoa')
plt.show()
(2)直方图
import matplotlib.pyplot as plt
population_ages = [22,55,62,45,21,22,34,42,42,4,99,102,110,120,1
21,122,130,111,115,112,80,75,65,54,44,43,42,48]
bins = [0,10,20,30,40,50,60,70,80,90,100,110,120,130]
plt.hist(population_ages, bins, histtype='bar', rwidth=0.8)
plt.xlabel('x')
plt.ylabel('y')
plt.title('Interesting Graph\nCheck it out')
plt.legend()
plt.show()
对于 plt.hist ,你首先需要放入所有的值,然后指定放入哪个桶或容器。在我们的例子中,我们绘制了一堆年龄,并希望以 10 年的增量来显示它们。 我们将条形的宽度设为 0.8,但是如果你想让条形变宽,或者变窄,你可以选择其他的宽度。
4、散点图
import matplotlib.pyplot as plt
x = [1,2,3,4,5,6,7,8]
y = [5,2,4,2,1,4,5,2]
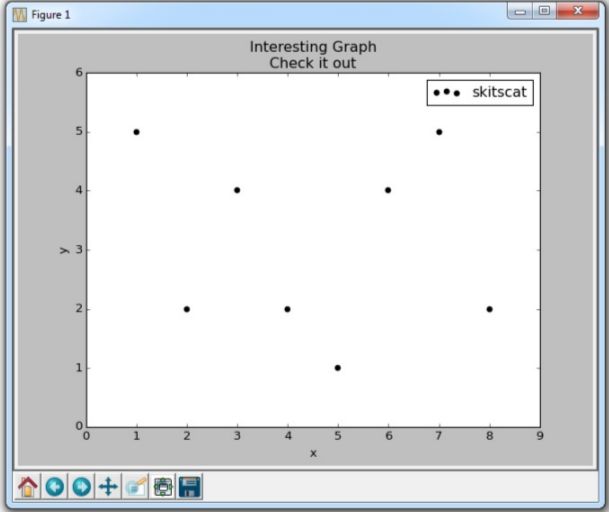
plt.scatter(x,y, label='skitscat', color='k', s=25, marker="o")
plt.xlabel('x')
plt.ylabel('y')
plt.title('Interesting Graph\nCheck it out')
plt.legend()
plt.show()
plt.scatter 不仅允许我们绘制 x 和 y ,而且还可以让我们决定所使用的标记
颜色,大小和类型。 有一堆标记选项,请参阅 Matplotlib 标记文档中的所有选项。https://matplotlib.org/api/markers_api.html
5、堆叠图
在这篇 Matplotlib 数据可视化教程中,我们要介绍如何创建堆叠图。 堆叠图用于显示『部分对整体』随时间的关系。 堆叠图基本上类似于饼图,只是随时间而变化。
让我们考虑一个情况,我们一天有 24 小时,我们想看看我们如何花费时间。 我们将我们的活动分为:睡觉,吃饭,工作和玩耍。
我们假设我们要在 5 天的时间内跟踪它,因此我们的初始数据将如下所示:
import matplotlib.pyplot as plt

days = [1,2,3,4,5]

sleeping = [7,8,6,11,7]
eating =   [2,3,4,3,2]
working =  [7,8,7,2,2]
playing = [8,5,7,8,13]因此,我们的x轴将包括day变量,即 1, 2, 3, 4 和 5。然后,日期的各个成分保存在它们各自的活动中。 像这样绘制它们:
plt.stackplot(days, sleeping,eating,working,playing, colors=['m','c','r','k'])

plt.xlabel('x')
plt.ylabel('y')
plt.title('Interesting Graph\nCheck it out')
plt.show()
在这里,我们可以至少在颜色上看到,我们如何花费我们的时间。 问题是,如果不回头看代码,我们不知道什么颜色是什么。 下一个问题是,对于多边形来说,我们实际上不能为数据添加『标签』。 因此,在任何不止是线条,带有像这样的填充或堆叠图的地方,我们不能以固有方式标记出特定的部分。 这不应该阻止程序员。 我们可以解决这个问题:
import matplotlib.pyplot as plt

days = [1,2,3,4,5]

sleeping = [7,8,6,11,7]
eating =   [2,3,4,3,2]
working =  [7,8,7,2,2]
playing =  [8,5,7,8,13]


plt.plot([],[],color='m', label='Sleeping', linewidth=5)
plt.plot([],[],color='c', label='Eating', linewidth=5)
plt.plot([],[],color='r', label='Working', linewidth=5)
plt.plot([],[],color='k', label='Playing', linewidth=5)

plt.stackplot(days, sleeping,eating,working,playing, colors=['m','c','r','k'])

plt.xlabel('x')
plt.ylabel('y')
plt.title('Interesting Graph\nCheck it out')
plt.legend()
plt.show()
我们在这里做的是画一些空行,给予它们符合我们的堆叠图的相同颜色,和正确标签。 我们还使它们线宽为 5,使线条在图例中显得较宽。 现在,我们可以很容易地看到,我们如何花费我们的时间。
6、饼图
饼图很像堆叠图,只是它们位于某个时间点。 通常,饼图用于显示部分对于整体的情况,通常以%为单位。 幸运的是,Matplotlib 会处理切片大小以及一切事情,我们只需要提供数值。
import matplotlib.pyplot as plt

slices = [7,2,2,13]
activities = ['sleeping','eating','working','playing']
cols = ['c','m','r','b']

plt.pie(slices,
        labels=activities,
        colors=cols,
        startangle=90,
        shadow= True,
        explode=(0,0.1,0,0),
        autopct='%1.1f%%')

plt.title('Interesting Graph\nCheck it out')
plt.show()
在plt.pie中,我们需要指定『切片』,这是每个部分的相对大小。 然后,我们指定相应切片的颜色列表。 接下来,我们可以选择指定图形的『起始角度』。 这使你可以在任何地方开始绘图。 在我们的例子中,我们为饼图选择了 90 度角,这意味着第一个部分是一个竖直线条。 接下来,我们可以选择给绘图添加一个字符大小的阴影,然后我们甚至可以使用explode拉出一个切片。
我们总共有四个切片,所以对于explode,如果我们不想拉出任何切片,我们传入0,0,0,0。 如果我们想要拉出第一个切片,我们传入0.1,0,0,0。
最后,我们使用autopct,选择将百分比放置到图表上面。
7、从文件加载数据
首先,我们将使用内置的csv模块加载CSV文件,然后我们将展示如何使用 NumPy(第三方模块)加载文件。
import matplotlib.pyplot as plt
import csv

x = []
y = []

with open('example.txt','r') as csvfile:
    plots = csv.reader(csvfile, delimiter=',')
    for row in plots:
        x.append(int(row[0]))
        y.append(int(row[1]))

plt.plot(x,y, label='Loaded from file!')
plt.xlabel('x')
plt.ylabel('y')
plt.title('Interesting Graph\nCheck it out')
plt.legend()
plt.show()
文件example.txt内容:
1,5
2,3
3,4
4,7
5,4
6,3
7,5
8,7
9,4
10,4
我们使用csv模块读取数据。 csv读取器自动按行分割文件,然后使用我们选择的分隔符分割文件中的数据。 在我们的例子中,这是一个逗号。 注意:csv模块和csv reader不需要文件在字面上是一个.csv文件。 它可以是任何具有分隔数据的简单的文本文件。
一旦我们这样做了,我们将索引为 0 的元素存储到x列表,将索引为 1 的元素存储到y列表中。 之后,我们都设置好了,准备绘图,然后显示数据。
虽然使用 CSV 模块是完全正常的,但使用 NumPy 模块来加载我们的文件和数据,可能对我们更有意义。
使用numpy代码如下,结果与上面一样

import matplotlib.pyplot as plt
import numpy as np

x, y = np.loadtxt('example.txt', delimiter=',', unpack=True)
plt.plot(x,y, label='Loaded from file!')

plt.xlabel('x')
plt.ylabel('y')
plt.title('Interesting Graph\nCheck it out')
plt.legend()
plt.show()
8、从网络加载数据
urllib包的使用
9、实时更新图表
当example.txt中的数据变化时,当前显示的图也变化,用到了animation函数
import matplotlib.pyplot as plt
import matplotlib.animation as animation
from matplotlib import style
style.use('fivethirtyeight')
fig = plt.figure()
ax1 = fig.add_subplot(1,1,1)
def animate(i):
graph_data = open('example.txt','r').read()
lines = graph_data.split('\n')
xs = []
ys = []
for line in lines:
if len(line) > 1:
x, y = line.split(',')
xs.append(x)
ys.append(y)
ax1.clear()
ax1.plot(xs, ys)
ani = animation.FuncAnimation(fig, animate, interval=1000)
plt.show()


