DOCTYPE html>
<html lang="en">
<head>
<meta charset="UTF-8">
<meta name="viewport" content="width=device-width, initial-scale=1.0">
<meta http-equiv="X-UA-Compatible" content="ie=edge">
<title>自定义图例legendtitle>
<style>
#chartcontainer {
margin: 50px auto;
text-align: center;
}
style>
head>
<script src="https://gw.alipayobjects.com/os/lib/antv/g2/3.4.10/dist/g2.min.js">script>
<body>
<div id="chartcontainer">div>
<script>
const data = [
{ month: 'Jan', city: 'Tokyo', temperature: 7 },
{ month: 'Jan', city: 'London', temperature: 3.9 },
{ month: 'Feb', city: 'Tokyo', temperature: 6.9 },
{ month: 'Feb', city: 'London', temperature: 4.2 },
{ month: 'Mar', city: 'Tokyo', temperature: 9.5 },
{ month: 'Mar', city: 'London', temperature: 5.7 },
{ month: 'Apr', city: 'Tokyo', temperature: 14.5 },
{ month: 'Apr', city: 'London', temperature: 8.5 },
{ month: 'May', city: 'Tokyo', temperature: 18.4 },
{ month: 'May', city: 'London', temperature: 11.9 },
{ month: 'Jun', city: 'Tokyo', temperature: 21.5 },
{ month: 'Jun', city: 'London', temperature: 15.2 },
{ month: 'Jul', city: 'Tokyo', temperature: 25.2 },
{ month: 'Jul', city: 'London', temperature: 17 },
{ month: 'Aug', city: 'Tokyo', temperature: 26.5 },
{ month: 'Aug', city: 'London', temperature: 16.6 },
{ month: 'Sep', city: 'Tokyo', temperature: 23.3 },
{ month: 'Sep', city: 'London', temperature: 14.2 },
{ month: 'Oct', city: 'Tokyo', temperature: 18.3 },
{ month: 'Oct', city: 'London', temperature: 10.3 },
{ month: 'Nov', city: 'Tokyo', temperature: 13.9 },
{ month: 'Nov', city: 'London', temperature: 6.6 },
{ month: 'Dec', city: 'Tokyo', temperature: 9.6 },
{ month: 'Dec', city: 'London', temperature: 4.8 },
]
const chart = new G2.Chart({
container: 'chartcontainer',
width: 800,
height: 500
});
chart.source(data);
chart.axis('temperature', {
position: 'right',
label: {
formatter: function formatter(val) {
return val + '°C';
}
}
});
chart.axis('month', {
label: {
offset: 12
}
});
chart.coord().transpose().scale(1, -1);
chart.legend('city',{
position: 'top'
})
chart.interval().position('month*temperature').color('city')
.adjust([{
type: 'dodge',
marginRatio: 1 / 32
}]);
chart.render();
script>
body>
html>
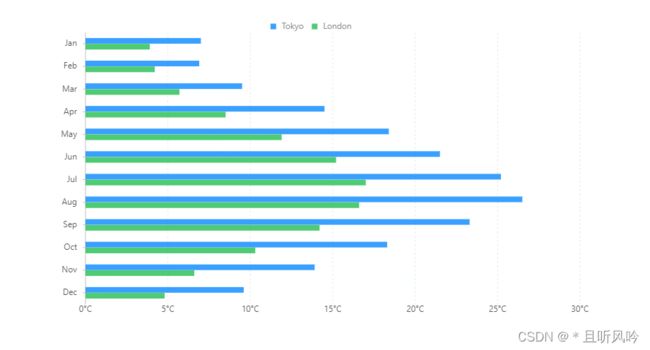
页面效果:

