- grafana 使用常见问题
magic_kid_2010
Grafanagrafana
一、点击panel没有反应,没有出现edit选项。方法一将鼠标放在panel的任意位置,然后键盘输入"e",然后再次点击title,即可出现选项框。方法二F12查看当前panelid,然后在浏览器url地址上拼接&editPanel=xxx即可
- Kubernetes日志运维痛点及日志系统架构设计 (Promtail+Loki+Grafana)
Kubernetes日志运维痛点及日志系统架构设计(Promtail+Loki+Grafana)运维痛点日志采集的可靠性与复杂性pod生命周期短、易销毁容器重启或Pod被销毁后,日志会丢失(除非已持久化或集中采集)。需要侧重于实时采集和转发,而不能依赖节点本地日志。多样化的日志来源与格式应用日志、系统日志、Kubernetes组件日志(如kubelet、kube-apiserver)、中间件日志(
- 自动化运维工程师实操面试题
以下是针对Ansible、Zabbix、ElasticsearchLogstashKibana(ELK)设计的2道综合实操题,难度适中且结合实际应用场景:实操题1:Ansible自动化部署Zabbix监控平台并集成ELK日志分析题目背景某企业需要通过Ansible自动化部署Zabbix监控服务器(含Agent)、Elasticsearch、Logstash、Kibana(ELK)日志分析系统,并实
- 构建企业级大模型运行监控体系:健康度五级指标与实战部署路径全解析
构建企业级大模型运行监控体系:健康度五级指标与实战部署路径全解析关键词:模型运行监控、健康度分级体系、DeepSeek、私有化部署、Prometheus、Grafana、异常检测、推理稳定性、性能观测、可视化大屏摘要:在DeepSeek大模型私有化部署的生产环境中,传统的“是否可用”监控已难以满足对模型稳定性、推理质量与异常风险的精细管理需求。为此,企业必须构建一套基于五级健康度模型的全维监控体系
- 安全分析:Zabbix 路径探测请求解析
Bruce_xiaowei
总结经验笔记渗透测试安全zabbix网络安全
安全分析:Zabbix路径探测请求解析作为网络安全工程师,我针对提供的HTTP请求数据进行了深度分析,以下是专业评估报告:请求关键特征分析特征项观测值风险等级请求路径/zabbix/srv_status.php?ddreset=1高危User-AgentMozilla/5.0(WindowsNT10.0;Win64;x64;rv:130.0)Gecko/20100101Firefox/130.0可
- Spring Cloud(微服务部署与监控)
白仑色
Spring系列springcloud微服务spring微服务部署服务监控健康检查
摘要在微服务架构中,随着服务数量的增长和部署复杂度的提升,如何高效部署、持续监控、快速定位问题并实现自动化运维成为保障系统稳定性的关键。本文将围绕SpringCloud微服务的部署与监控展开,深入讲解:微服务打包与部署方式(JAR/Docker/Kubernetes)如何构建CI/CD流水线服务健康检查与自动恢复机制Prometheus+Grafana实现指标可视化监控ELK实现日志集中管理Sky
- zabbix监控jmx
寰宇001
监控/自动化工具
介绍背景:目前公司用的主要语言就是java,然后在运维过程中会遇到频繁的内存溢出的情况,之前使用过elk日志分析系统可以实时的判断出内存溢出的情况,但是无法查看内存的使用情况,只能通过dump文件查看内存溢出的时候dump下来的文件去分析。这样也无法准确的判断出问题。zabbix可以监控java,并且将内存的使用情况实时的展现出来,这是一个不错的选择。JMX的全称是JavaManagementEx
- 安装部署zabbix监控ELK日志:(centos 7 )完整文档
Liberation-army
linuxzabbixelk
今天接到公司领导要求,要求用zabbix能够实时的监控所有服务器的报错报警日志。但是因为服务器数量较大,日志量很大,单独做脚本分析日志来上报的话消耗资源可能会比较大,因此就使用了已经部署了的elk来把错误的日志单独整理上报,然后就在网上查询资料找到了ZABBIX+ELK的部署,经过十几个小时的尝试和测试,已经能够成功的监控到错误和告警日志了,因为部署过程中踩了很多坑,因此整理整个流程把相关的内容发
- Zabbix和Prometheus的区别
运维小贺
zabbixprometheus运维
Zabbix监控平台监控概念对服务的管理,不能仅限于可用性。还需要服务可以安全、稳定、高效地运行。监控的目的:早发现、早治疗。被监控的资源类型:公开数据:对外开放的,不需要认证即可获取的数据私有数据:对外不开放,需要认证、权限才能获得的数据Zabbix是什么?Zabbix是个适用于监控硬件服务器的一款开源的分布式监控方案实施监控的几个方面:数据采集:使用agent(可安装软件的系统上)、SNMP(
- 半导体FAB中的服务器硬件故障监控与预防全方案:从预警到零宕机实战
爱吃青菜的大力水手
服务器运维半导体FAB运维IT运维
服务器硬件故障监控与预防全方案:从预警到零宕机实战关键词:SMART监控RAID预警IPMI传感器性能基线PrometheusZabbix高可用架构一、硬件故障前的7大预警信号(附关联工具)故障类型关键指标监控工具预警阈值磁盘故障Reallocated_Sector_Countsmartctl+smartd>0立即告警Current_Pending_SectorPrometheus+NodeExp
- Istio 深度解析与实战:从原理到应用的全面指南
阿贾克斯的黎明
javaistio网络云原生
目录Istio深度解析与实战:从原理到应用的全面指南一、Istio原理深度剖析1.数据平面2.控制平面二、Istio的安装与部署1.环境准备2.安装Istio3.注入Sidecar三、Istio实战应用场景1.流量管理(1)简单路由(2)流量镜像2.安全防护(1)服务间双向认证(2)基于角色的访问控制(RBAC)3.监控与可观测性(1)启用Prometheus和Grafana(2)查看监控指标四、
- Docker 方式安装 Zabbix 7.0 LTS 支持版本
运维阿峰
Zabbixdockerzabbix容器
文章目录1.介绍(1)zabbix官网可用的docker镜像(2)zabbix镜像常用的挂载点2.安装配置zabbixserver3.配置1.介绍(1)zabbix官网可用的docker镜像在DockerHub中可用的镜像://zabbixagentzabbix/zabbix-agent//zabbixserverzabbix/zabbix-server-mysqlzabbix/zabbix-se
- 【收藏】 Kafka监控组件大全
weixin_34038652
大数据操作系统netty
本文使用Burrow和Telegraf搭建Kafka的监控体系。然后,简单介绍一下其他的,比如KafkaManager,KafkaEagle,ConfluentControlCenter等。如果你对kafka比较陌生,请参考:Kafka基础知识索引Burrow依赖路径使用Burrow拉取kafka的监控信息,然后通过telegraf进行收集,最后写入到influxdb中。使用grafana进行展示
- AI原生应用微服务监控:Prometheus+Grafana实战
AI原生应用开发
AI-native微服务prometheusai
AI原生应用微服务监控:Prometheus+Grafana实战关键词:微服务监控、Prometheus、Grafana、AI应用、指标收集、可视化告警、云原生摘要:本文将深入探讨如何为AI原生应用构建完整的微服务监控系统。我们将从基础概念出发,详细介绍Prometheus的指标收集机制和Grafana的可视化能力,并通过实际案例展示如何搭建完整的监控解决方案。文章包含详细的配置示例、架构图解和最
- zabbix监控方式(04) -Zabbix Java gateway
抠jue大仙
zabbix那点事儿zabbixcentosubuntu
概述从Zabbix2.0开始,以Zabbix守护进程方式原生支持监控JMX应用程序就存在了,称之为“ZabbixJavagateway”。ZabbixJavagateway的守护进程是用Java编写。为了在特定主机上找到JMX计数器的值,Zabbixserver向ZabbixJavagateway发送请求,后者使用JMX管理API来远程查询相关的应用。该应用不需要安装额外的软件。只需要在启动时,命
- Gitea 服务器监控面板的搭建
shengyin714959
笔记最高笔记服务器gitea数据库
Prometheus是一个开源的服务监控系统和时序数据库。Grafana是一个可视化的数据分析面板,它可以从Prometheus中查询时序数据,绘制漂亮的数据图表。本文作者在实践中使用Prometheus抓取和存储Gitea服务器的运行数据,并基于Grafana提供的开源数据面板创建了一个自己服务器的Gitea性能监控面板。工作原理为了更清晰地理解Prometheus的工作原理,我在下方列出了Pr
- Promtail收集docker容器的日志
jingleli21
docker
什么是Promtail?Promtail是Linux操作系统上的一个服务,它会扫描日志文件,并将它们提取到Loki中。Loki是Grafana的一个日志聚合工具,它类似于Prometheus,但主要用于日志数据。Promtail能够自动发现运行中的Docker容器,并抓取它们的日志。Promtail的工作原理Promtail的工作原理可以简单概括为以下几个步骤:监控日志文件:Promtail不断扫
- 16.7 Prometheus+Grafana实战:容器化监控与日志聚合一站式解决方案
少林码僧
prometheusgrafana人工智能langchainllama语言模型机器学习
《Prometheus+Grafana实战:容器化监控与日志聚合一站式解决方案》关键词:容器化监控、日志聚合、Prometheus、Grafana、ELKStack、用户反馈收集容器化监控与日志系统的架构设计在LanguageMentorAgent生产部署中,监控系统需要覆盖以下维度:
- prometheus+grafana+MySQL监控
甲柒
运维监控prometheusgrafanamysql
prometheus+grafana+MySQL监控环境说明操作前提:先去搭建Docker部署prometheus+grafana+...这篇文章的系统Docker部署prometheus+grafana+...的参考文章:Docker部署prometheus+grafana+…-CSDN博客在的节点服务器上搭建MySQL数据库(可以采用直接安装或者docker部署)搭建MySQL数据库的参考文章
- Prometheus + Grafana监控方案详解:从入门到实战
风偷走了蒲公
开发知识PrometheusGrafana监控DevOpsNode.js
Prometheus+Grafana监控方案详解:从入门到实战1.引言在现代分布式系统中,监控是保障系统稳定性的关键。Prometheus作为一款开源的监控工具,结合Grafana的可视化能力,能够提供强大的监控解决方案。本文将详细介绍Prometheus+Grafana的监控方案,并通过丰富的代码示例和应用场景帮助读者快速掌握。2.Prometheus基础2.1Prometheus简介Prome
- Kylin Linux Advanced Server V10 离线安装 Prometheus + Grafana + node_exporter指南
晴空06
操作系统管理工具性能测试kylinlinuxprometheus
离线安装Prometheus+Grafana+InfluxDB指南(KylinLinuxAdvancedServerV10)最终结果展示准备工作在一台有互联网连接的机器上下载所有必要的安装包和依赖准备一个USB驱动器或内部网络共享位置来传输文件确保目标服务器有足够的资源运行这些服务下载离线安装包在有网络的机器上下载以下组件:Prometheuswgethttps://github.com/prom
- Sentinel:微服务稳定性的守护者
未来并未来
sentinel微服务java
首先,我们要明确Sentinel在微服务架构中的定位。Sentinel并不是一个全功能的监控或追踪系统(比如Prometheus+Grafana组合或Jaeger/Zipkin),它的核心定位是流量控制(TrafficControl)和熔断降级(CircuitBreaking&Degradation)。简单理解,它的任务就是:管住流量:监控服务接口的访问量,当流量超过设定的阈值时,进行拦截(限流)
- OSS监控体系搭建:Prometheus+Grafana实时监控流量、错误码、存储量(开源方案替代云监控自定义视图)
大熊计算机
#阿里云prometheusgrafana开源
1.开源监控方案核心架构设计(1)技术选型对比分析当前主流OSS监控方案可分为三类:云厂商自带监控(如阿里云云监控)开源方案(Prometheus生态)商业APM工具(如Datadog)通过以下维度进行对比:维度云监控自定义视图Prometheus+Grafana商业APM工具数据采集粒度1分钟15秒(可调)10秒存储成本按量收费自控存储周期高额订阅费告警灵活性基础阈值告警支持PromQL复杂逻辑
- java全家桶之35: jvm如何调优
leijmdas
java
JVM调优指南:提升性能与稳定性JVM调优是Java应用性能优化的关键环节,合理的调优可以显著提高应用吞吐量、降低延迟并减少资源消耗。以下是系统的JVM调优方法和实践:一、调优基础准备监控先行使用工具收集基线数据:jstat-监控GC情况jstack-分析线程堆栈jmap-内存分析VisualVM/Arthas-可视化监控Prometheus+Grafana-生产级监控确定优化目标吞吐量优先(批处
- 高并发下分布式数据库性能下降的解决方法
网硕互联的小客服
分布式数据库
在高并发场景下,分布式数据库性能下降是一个常见的问题。通常表现为查询延迟增加、写入速度变慢或系统资源耗尽。这种情况的原因可能包括数据热点、网络延迟、锁竞争、存储瓶颈等。以下是解决分布式数据库性能下降的详细方法。1.分析性能瓶颈在解决问题之前,需要明确性能下降的原因。可以通过以下方式分析系统瓶颈:监控数据库性能指标:使用监控工具(如Prometheus+Grafana)查看CPU、内存、磁盘I/O和
- 基于飞书webHook机器人实现shell脚本监听端口并报警
神志不清.
运维脚本服务器监控linux服务器bash运维
今天zabbix报警不知道什么原因端口挂了3个却没报警,经过我的决定准备对端口这种重要性监控增加报警手段。以下脚本内容可实现端口报警,配合计划任务crontab-e来制定自己监听的频率我的是每分钟都执行一次#!/bin/bash#端口预警脚本date=$(date"+%Y-%m-%d%H:%M:%S")#根据实际情况修改webhook飞书地址webhook="https://open.feishu
- Java 与 MySQL 性能优化:Linux服务器上MySQL性能指标解读与监控方法
程序员岳彬
Java运维手册服务器javamysql后端性能优化linux
文章目录一、关键性能指标解读1.QPS(QueriesPerSecond)2.TPS(TransactionsPerSecond)3.缓存命中率二、性能监控方法1.使用SHOWSTATUS命令进行监控2.使用Prometheus+Grafana进行监控(1)安装和配置Prometheus(2)安装和配置MySQLExporter(3)安装和配置Grafana(4)创建监控仪表盘三、总结在数据库的日
- MySQL性能监控与优化全攻略
逼得大师天才
mysql数据库
1.全方位监控体系搭建(1)监控指标分类类别关键指标报警阈值工具性能指标QPS/TPS/响应时间>500ms查询Prometheus资源指标CPU/内存/磁盘IOCPU>80%Grafana连接指标连接数/活跃连接连接数>max_connections*0.8PMM存储指标磁盘空间/表大小磁盘>85%Zabbix(2)主流监控方案对比方案优点缺点适用场景Prometheus+Granfa开源灵活,
- StarRocks+Prometheus+Grafana安装部署
XiaoQiong.Zhang
数据库bigdata大数据
检查服务器环境系统版本>=Centos7.0BE节点确认CPU是否支持AVX2指令集cat/proc/cpuinfo|grepavx2 下载DownloadStarRocksFree|StarRocksDownload|PrometheusDownloadGrafana|GrafanaLabsStarRocks安装(单节点为例)FE]$tar-zxfStarRocks-2.5.6.tar.gz
- 云原生监控体系建设:Prometheus+Grafana的企业级实践
大咖分享课
云原生prometheusgrafana
目录引言云原生监控体系概述什么是云原生监控Prometheus和Grafana的核心角色大模型私有化部署vs云端服务私有化部署的优势与挑战云端服务的优势与挑战决策框架:如何选择合适的部署方式成本模型分析私有化部署的成本构成云端服务的成本构成成本对比与优化策略Prometheus+Grafana的企业级实践架构设计与部署流程关键配置与优化可视化监控仪表盘案例分析:企业级监控实践总结与展望引言在云原生
- 异常的核心类Throwable
无量
java源码异常处理exception
java异常的核心是Throwable,其他的如Error和Exception都是继承的这个类 里面有个核心参数是detailMessage,记录异常信息,getMessage核心方法,获取这个参数的值,我们可以自己定义自己的异常类,去继承这个Exception就可以了,方法基本上,用父类的构造方法就OK,所以这么看异常是不是很easy
package com.natsu;
- mongoDB 游标(cursor) 实现分页 迭代
开窍的石头
mongodb
上篇中我们讲了mongoDB 中的查询函数,现在我们讲mongo中如何做分页查询
如何声明一个游标
var mycursor = db.user.find({_id:{$lte:5}});
迭代显示游标数
- MySQL数据库INNODB 表损坏修复处理过程
0624chenhong
tomcatmysql
最近mysql数据库经常死掉,用命令net stop mysql命令也无法停掉,关闭Tomcat的时候,出现Waiting for N instance(s) to be deallocated 信息。查了下,大概就是程序没有对数据库连接释放,导致Connection泄露了。因为用的是开元集成的平台,内部程序也不可能一下子给改掉的,就验证一下咯。启动Tomcat,用户登录系统,用netstat -
- 剖析如何与设计人员沟通
不懂事的小屁孩
工作
最近做图烦死了,不停的改图,改图……。烦,倒不是因为改,而是反反复复的改,人都会死。很多需求人员不知该如何与设计人员沟通,不明白如何使设计人员知道他所要的效果,结果只能是沟通变成了扯淡,改图变成了应付。
那应该如何与设计人员沟通呢?
我认为设计人员与需求人员先天就存在语言障碍。对一个合格的设计人员来说,整天玩的都是点、线、面、配色,哪种构图看起来协调;哪种配色看起来合理心里跟明镜似的,
- qq空间刷评论工具
换个号韩国红果果
JavaScript
var a=document.getElementsByClassName('textinput');
var b=[];
for(var m=0;m<a.length;m++){
if(a[m].getAttribute('placeholder')!=null)
b.push(a[m])
}
var l
- S2SH整合之session
灵静志远
springAOPstrutssession
错误信息:
Caused by: org.springframework.beans.factory.BeanCreationException: Error creating bean with name 'cartService': Scope 'session' is not active for the current thread; consider defining a scoped
- xmp标签
a-john
标签
今天在处理数据的显示上遇到一个问题:
var html = '<li><div class="pl-nr"><span class="user-name">' + user
+ '</span>' + text + '</div></li>';
ulComme
- Ajax的常用技巧(2)---实现Web页面中的级联菜单
aijuans
Ajax
在网络上显示数据,往往只显示数据中的一部分信息,如文章标题,产品名称等。如果浏览器要查看所有信息,只需点击相关链接即可。在web技术中,可以采用级联菜单完成上述操作。根据用户的选择,动态展开,并显示出对应选项子菜单的内容。 在传统的web实现方式中,一般是在页面初始化时动态获取到服务端数据库中对应的所有子菜单中的信息,放置到页面中对应的位置,然后再结合CSS层叠样式表动态控制对应子菜单的显示或者隐
- 天-安-门,好高
atongyeye
情感
我是85后,北漂一族,之前房租1100,因为租房合同到期,再续,房租就要涨150。最近网上新闻,地铁也要涨价。算了一下,涨价之后,每次坐地铁由原来2块变成6块。仅坐地铁费用,一个月就要涨200。内心苦痛。
晚上躺在床上一个人想了很久,很久。
我生在农
- android 动画
百合不是茶
android透明度平移缩放旋转
android的动画有两种 tween动画和Frame动画
tween动画;,透明度,缩放,旋转,平移效果
Animation 动画
AlphaAnimation 渐变透明度
RotateAnimation 画面旋转
ScaleAnimation 渐变尺寸缩放
TranslateAnimation 位置移动
Animation
- 查看本机网络信息的cmd脚本
bijian1013
cmd
@echo 您的用户名是:%USERDOMAIN%\%username%>"%userprofile%\网络参数.txt"
@echo 您的机器名是:%COMPUTERNAME%>>"%userprofile%\网络参数.txt"
@echo ___________________>>"%userprofile%\
- plsql 清除登录过的用户
征客丶
plsql
tools---preferences----logon history---history 把你想要删除的删除
--------------------------------------------------------------------
若有其他凝问或文中有错误,请及时向我指出,
我好及时改正,同时也让我们一起进步。
email : binary_spac
- 【Pig一】Pig入门
bit1129
pig
Pig安装
1.下载pig
wget http://mirror.bit.edu.cn/apache/pig/pig-0.14.0/pig-0.14.0.tar.gz
2. 解压配置环境变量
如果Pig使用Map/Reduce模式,那么需要在环境变量中,配置HADOOP_HOME环境变量
expor
- Java 线程同步几种方式
BlueSkator
volatilesynchronizedThredLocalReenTranLockConcurrent
为何要使用同步? java允许多线程并发控制,当多个线程同时操作一个可共享的资源变量时(如数据的增删改查), 将会导致数据不准确,相互之间产生冲突,因此加入同步锁以避免在该线程没有完成操作之前,被其他线程的调用, 从而保证了该变量的唯一性和准确性。 1.同步方法&
- StringUtils判断字符串是否为空的方法(转帖)
BreakingBad
nullStringUtils“”
转帖地址:http://www.cnblogs.com/shangxiaofei/p/4313111.html
public static boolean isEmpty(String str)
判断某字符串是否为空,为空的标准是 str==
null
或 str.length()==
0
- 编程之美-分层遍历二叉树
bylijinnan
java数据结构算法编程之美
import java.util.ArrayList;
import java.util.LinkedList;
import java.util.List;
public class LevelTraverseBinaryTree {
/**
* 编程之美 分层遍历二叉树
* 之前已经用队列实现过二叉树的层次遍历,但这次要求输出换行,因此要
- jquery取值和ajax提交复习记录
chengxuyuancsdn
jquery取值ajax提交
// 取值
// alert($("input[name='username']").val());
// alert($("input[name='password']").val());
// alert($("input[name='sex']:checked").val());
// alert($("
- 推荐国产工作流引擎嵌入式公式语法解析器-IK Expression
comsci
java应用服务器工作Excel嵌入式
这个开源软件包是国内的一位高手自行研制开发的,正如他所说的一样,我觉得它可以使一个工作流引擎上一个台阶。。。。。。欢迎大家使用,并提出意见和建议。。。
----------转帖---------------------------------------------------
IK Expression是一个开源的(OpenSource),可扩展的(Extensible),基于java语言
- 关于系统中使用多个PropertyPlaceholderConfigurer的配置及PropertyOverrideConfigurer
daizj
spring
1、PropertyPlaceholderConfigurer
Spring中PropertyPlaceholderConfigurer这个类,它是用来解析Java Properties属性文件值,并提供在spring配置期间替换使用属性值。接下来让我们逐渐的深入其配置。
基本的使用方法是:(1)
<bean id="propertyConfigurerForWZ&q
- 二叉树:二叉搜索树
dieslrae
二叉树
所谓二叉树,就是一个节点最多只能有两个子节点,而二叉搜索树就是一个经典并简单的二叉树.规则是一个节点的左子节点一定比自己小,右子节点一定大于等于自己(当然也可以反过来).在树基本平衡的时候插入,搜索和删除速度都很快,时间复杂度为O(logN).但是,如果插入的是有序的数据,那效率就会变成O(N),在这个时候,树其实变成了一个链表.
tree代码:
- C语言字符串函数大全
dcj3sjt126com
cfunction
C语言字符串函数大全
函数名: stpcpy
功 能: 拷贝一个字符串到另一个
用 法: char *stpcpy(char *destin, char *source);
程序例:
#include <stdio.h>
#include <string.h>
int main
- 友盟统计页面技巧
dcj3sjt126com
技巧
在基类调用就可以了, 基类ViewController示例代码
-(void)viewWillAppear:(BOOL)animated
{
[super viewWillAppear:animated];
[MobClick beginLogPageView:[NSString stringWithFormat:@"%@",self.class]];
- window下在同一台机器上安装多个版本jdk,修改环境变量不生效问题处理办法
flyvszhb
javajdk
window下在同一台机器上安装多个版本jdk,修改环境变量不生效问题处理办法
本机已经安装了jdk1.7,而比较早期的项目需要依赖jdk1.6,于是同时在本机安装了jdk1.6和jdk1.7.
安装jdk1.6前,执行java -version得到
C:\Users\liuxiang2>java -version
java version "1.7.0_21&quo
- Java在创建子类对象的同时会不会创建父类对象
happyqing
java创建子类对象父类对象
1.在thingking in java 的第四版第六章中明确的说了,子类对象中封装了父类对象,
2."When you create an object of the derived class, it contains within it a subobject of the base class. This subobject is the sam
- 跟我学spring3 目录贴及电子书下载
jinnianshilongnian
spring
一、《跟我学spring3》电子书下载地址:
《跟我学spring3》 (1-7 和 8-13) http://jinnianshilongnian.iteye.com/blog/pdf
跟我学spring3系列 word原版 下载
二、
源代码下载
最新依
- 第12章 Ajax(上)
onestopweb
Ajax
index.html
<!DOCTYPE html PUBLIC "-//W3C//DTD XHTML 1.0 Transitional//EN" "http://www.w3.org/TR/xhtml1/DTD/xhtml1-transitional.dtd">
<html xmlns="http://www.w3.org/
- BI and EIM 4.0 at a glance
blueoxygen
BO
http://www.sap.com/corporate-en/press.epx?PressID=14787
有机会研究下EIM家族的两个新产品~~~~
New features of the 4.0 releases of BI and EIM solutions include:
Real-time in-memory computing –
- Java线程中yield与join方法的区别
tomcat_oracle
java
长期以来,多线程问题颇为受到面试官的青睐。虽然我个人认为我们当中很少有人能真正获得机会开发复杂的多线程应用(在过去的七年中,我得到了一个机会),但是理解多线程对增加你的信心很有用。之前,我讨论了一个wait()和sleep()方法区别的问题,这一次,我将会讨论join()和yield()方法的区别。坦白的说,实际上我并没有用过其中任何一个方法,所以,如果你感觉有不恰当的地方,请提出讨论。
&nb
- android Manifest.xml选项
阿尔萨斯
Manifest
结构
继承关系
public final class Manifest extends Objectjava.lang.Objectandroid.Manifest
内部类
class Manifest.permission权限
class Manifest.permission_group权限组
构造函数
public Manifest () 详细 androi
- Oracle实现类split函数的方
zhaoshijie
oracle
关键字:Oracle实现类split函数的方
项目里需要保存结构数据,批量传到后他进行保存,为了减小数据量,子集拼装的格式,使用存储过程进行保存。保存的过程中需要对数据解析。但是oracle没有Java中split类似的函数。从网上找了一个,也补全了一下。
CREATE OR REPLACE TYPE t_split_100 IS TABLE OF VARCHAR2(100);
cr
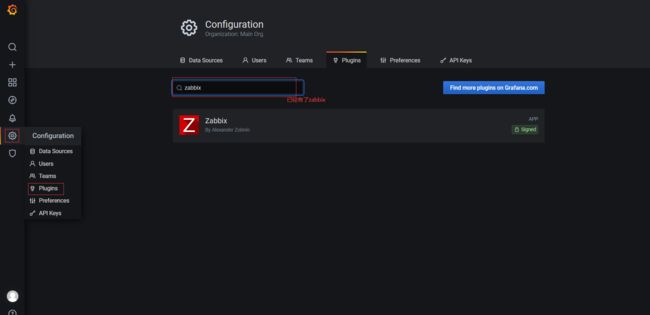


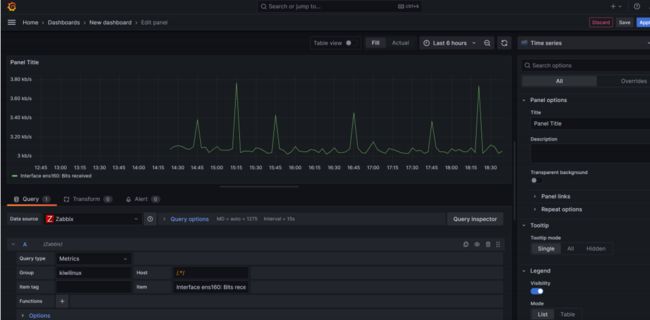
 返回上一级看到zabbix就添加成功了

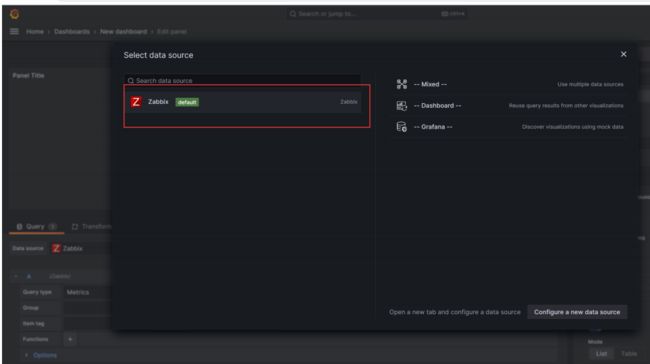
 选择zabbix