TOOLS_Pandas根据日期列进行分组统计及绘图的使用示例
Pandas根据日期列进行分组统计及绘图的使用示例
导入所需要的库
# coding=utf-8
from logging import warning
import os, sys
import datetime
import numpy as np
import pandas as pd
import matplotlib.pyplot as plt


# 处理plt中文显示问题
plt.rcParams["font.sans-serif"] = ["SimHei"]  # 正常显示中文标签
plt.rcParams["axes.unicode_minus"] = False  # 解决负号显示为方块的问题
# 读取测试数据
df = pd.read_excel("./无标题1.xlsx")
df.head()
| m_id | max_iv | record_id | record_name | record_sub_name | pub_time | language | version | create_time | count_singer | |
|---|---|---|---|---|---|---|---|---|---|---|
| 0 | 000DmZbU1RUrem | 49359 | 118379 | 野摩托 | NaN | 2021-04-15 | 1.0 | NaN | 2022-09-28 22:27:54 | 1 |
| 1 | 000SOicI1YXaDP | 6035 | 981658 | 不可以这样(反英雄) | NaN | 2021-04-15 | 1.0 | NaN | 2022-09-29 05:29:02 | 1 |
| 2 | 000ibM5x4Jx2f4 | 9782 | 425705 | 心存侥幸 | NaN | 2021-04-15 | 1.0 | NaN | 2022-09-29 01:00:03 | 1 |
| 3 | 004OL7tM1gklPK | 12212 | 310361 | 如果在一起 | NaN | 2021-04-15 | 1.0 | NaN | 2022-09-29 00:03:17 | 1 |
| 4 | 004D5jPe0h8Q6C | 12194 | 413841 | 钗头凤.十年生死两茫茫 | NaN | 2021-04-15 | 1.0 | NaN | 2022-09-29 00:54:41 | 1 |
日期列非index的处理方式
对日期列series进行apply变换处理,得到用于分组的key:
- 对 pub_time 列进行 year和month的key提取;
- 然后将其送入 数据框 的groupby;
- 然后对分组内容进行 相应统计值的方法调用;
# 日期非index的处理方式

key_year = lambda x:x.year
key_month = lambda x:x.month

# 按年
# df1 =  df.groupby(df['pub_time'].apply(key_year)).count()

# 按月
# df1 = df.groupby(df['pub_time'].apply(key_month)).count()

# 按年月
df1 = df.groupby([df['pub_time'].apply(key_year),df['pub_time'].apply(key_month)]).count() # 还可以取first() 及其他统计值

df1['m_id']
pub_time  pub_time
2021      4            567
          5           1026
          6           1163
          7           1337
          8           1386
          9           1465
          10          1498
          11          1478
          12          1482
2022      1           1205
          2            761
          3           1224
          4           1410
          5           1324
          6           1347
          7            966
          8            965
          9            909
          10           639
          11           145
Name: m_id, dtype: int64
# 绘制每 年,月 数量
df1['m_id'].plot()
plt.title('完整时序指数数据每月数量')
plt.xlabel('year,month')
plt.ylabel('m_id count')
plt.grid()
plt.show()
[外链图片转存失败,源站可能有防盗链机制,建议将图片保存下来直接上传(img-4JLTHrIi-1668063889609)(output_6_0.png)]

日期作为index的处理方式
# 日期作为index的处理方式
df.index = pd.to_datetime(df.pub_time)

# df.shape # shape size
# df = df[ df['pub_time'] > '2019-01-01'] # 条件过滤
# df = df[df["count_singer"] == 1] # 条件过滤
# df.drop_duplicates(subset=['record_name'],keep='first',inplace=True) # 去重


df2 = df.groupby([df.index.year, df.index.month]).count()
df2['m_id']

# ym_max = df.groupby([df.index.year, df.index.month]).apply(lambda t: t[t.max_iv==t.max_iv.max()])
# print('ym_max:',ym_max)

# ym_min = df.groupby([df.index.year, df.index.month]).apply(lambda t: t[t.max_iv==t.max_iv.min()])
# print('ym_min:',ym_min)

ym_agg = df.groupby([df.index.year, df.index.month]).agg({'max_iv':['max','mean','min','count']})
ym_agg
| max_iv | |||||
|---|---|---|---|---|---|
| max | mean | min | count | ||
| pub_time | pub_time | ||||
| 2021 | 4 | 4211890 | 66834.209877 | 6027 | 567 |
| 5 | 5412956 | 77094.117934 | 6005 | 1026 | |
| 6 | 2744863 | 72879.793637 | 6000 | 1163 | |
| 7 | 5951717 | 78934.391922 | 6003 | 1337 | |
| 8 | 3580162 | 57704.013709 | 6008 | 1386 | |
| 9 | 4550319 | 59929.767235 | 6008 | 1465 | |
| 10 | 3771055 | 53772.278371 | 6008 | 1498 | |
| 11 | 6242104 | 72782.085250 | 6001 | 1478 | |
| 12 | 6362646 | 84906.529690 | 6008 | 1482 | |
| 2022 | 1 | 2020534 | 61655.124481 | 6007 | 1205 |
| 2 | 9325015 | 75054.328515 | 6016 | 761 | |
| 3 | 1808215 | 58802.951797 | 6000 | 1224 | |
| 4 | 10932500 | 81737.102837 | 6009 | 1410 | |
| 5 | 4690690 | 74068.342900 | 6004 | 1324 | |
| 6 | 4581750 | 63106.034892 | 6003 | 1347 | |
| 7 | 15988460 | 100434.186335 | 6017 | 966 | |
| 8 | 107315642 | 211451.452850 | 6001 | 965 | |
| 9 | 4125236 | 90661.900990 | 6007 | 909 | |
| 10 | 1450976 | 80869.020344 | 6007 | 639 | |
| 11 | 2586974 | 133693.703448 | 6056 | 145 | |
ym_agg.plot()
plt.xlabel('year,month')
plt.ylabel('max_iv analysis')
plt.grid()
plt.show()
[外链图片转存失败,源站可能有防盗链机制,建议将图片保存下来直接上传(img-9GFZFVGr-1668063889611)(output_9_0.png)]

ym_agg.max_iv['mean'].plot()
plt.xlabel('year,month')
plt.ylabel('max_iv mean')
plt.grid()
plt.show()
[外链图片转存失败,源站可能有防盗链机制,建议将图片保存下来直接上传(img-TMWDeO8s-1668063889611)(output_10_0.png)]

ym_agg.max_iv['max'].plot()
plt.xlabel('year,month')
plt.ylabel('max_iv max')
plt.grid()
plt.show()
[外链图片转存失败,源站可能有防盗链机制,建议将图片保存下来直接上传(img-0cPUHXLn-1668063889612)(output_11_0.png)]

ym_agg.max_iv['min'].plot()
plt.xlabel('year,month')
plt.ylabel('max_iv min')
plt.grid()
plt.show()
[外链图片转存失败,源站可能有防盗链机制,建议将图片保存下来直接上传(img-0D9D7Il7-1668063889612)(output_12_0.png)]

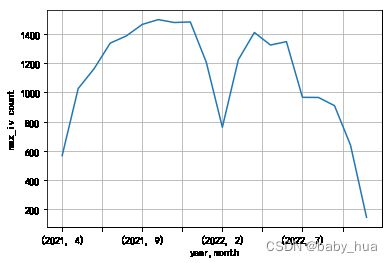
ym_agg.max_iv['count'].plot()
plt.xlabel('year,month')
plt.ylabel('max_iv count')
plt.grid()
plt.show()
[外链图片转存失败,源站可能有防盗链机制,建议将图片保存下来直接上传(img-fi2rCmfL-1668063889613)(output_13_0.png)]