4.搭建压测可视化平台-如何离线完成
目录
- 概述
- 前置
- 安装 InfluxDB
-
- 下载 InfluxDB
- 启动 InfluxDB
- 进入容器内部
- influxdb相关参数
- 运行验证
- 安装 Grafana
-
- 下载 Grafana 镜像
- 启动 Grafana 容器
- 验证部署
- grafana串联influxdb
- 导入模板
- 安装 node_exporter
- 安装 prometheus
-
- 下载解压运行
- 配置 prometheus
- 问题
- 结束
概述
今日涉及的技术比较多,会将相关文章以列表的形式,在前置中显示 ,整体效果如下图
前置
安装可视化平台,需要一些前置条件,如下表:
| 文章 | 链接 |
|---|---|
| docker linux离线环境安装 20.1.0.12 | 地址 |
| JMeter压测接口 | 地址 |
| JMeter高级使用-让你与众不同 | 地址 |
安装 InfluxDB
下载 InfluxDB
在线安装走下面路线,离线安装走此路线。
docker pull influxdb:1.8
启动 InfluxDB
启动 InfluxDB 的容器,并将端口 8083 和 8086 映射出来:
docker run -d --name influxdb -p 8086:8086 -p 8083:8083 influxdb:1.8

进入容器内部
进入容器内部,创建名为 jmeter 的数据:
进入 jmeter-influx 容器
docker exec -it influxdb /bin/bash
- 输入 influx 命令,即可进入 influx 操作界面
- 输入 create database jmeter 命令,创建名为 jmeter 的数据库
- 输入 show databases 命令,查看数据库是否创建成功
[root@hadoop01 ~]# docker exec -it influxdb /bin/bash
root@bfb5c0cb29e9:/# influx
Connected to http://localhost:8086 version 1.8.10
InfluxDB shell version: 1.8.10
> create database jmeter
> show databases
name: databases
name
----
_internal
jmeter
> use jmeter
Using database jmeter
> select * from jmeter
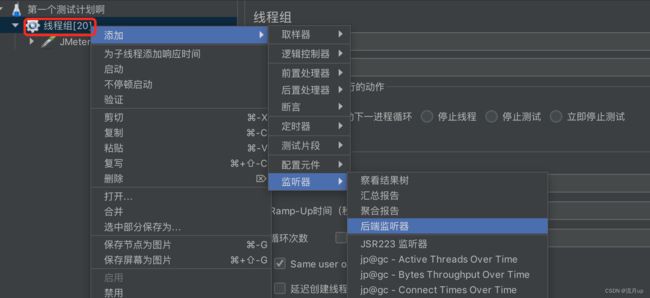
influxdb相关参数
jmeter 进行相关的配置,如对 jmeter 有疑问,请移步至 JMeter压测接口


对上图相关属性进行说明,如下:
- influxdbUrl:改为自己的 influxdb 的部署 ip 和映射端口
- application:可根据需要自由定义,只是注意后面在 grafana 中选对即可
- measurement:表名,默认是 jmeter,也可以自定义
- summaryOnly:选择 true 的话就只有总体的数据,false 会记录总体数据,然后再将每个 transaction 都分别记录
- samplersRegex: 样本正则表达式,将匹配的样本发送到数据库
- testTitle:events 表中的 txt 字段的内容
- eventTags:任务标签,配合 Grafana 一起使用
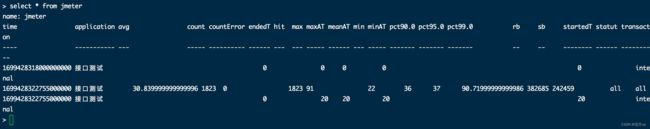
运行验证
运行 JMeter 脚本,然后再次在 influxdb 中查看数据,发现类似下面的数据,说明输入导入成功。
安装 Grafana
下载 Grafana 镜像
在线安装走下面路线,离线安装走此路线。
docker pull grafana/grafana
启动 Grafana 容器
启动 Grafana 容器,将 3000 端口映射出来
docker run -d --name grafana -p 3000:3000 grafana/grafana

验证部署
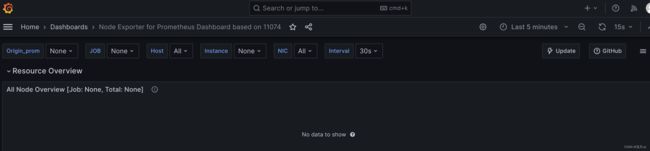
网页端访问 http://10.32.xx.142:3000 ,验证部署成功。

grafana串联influxdb


上述三张图上的内容,配置完成后,保存测试如下图

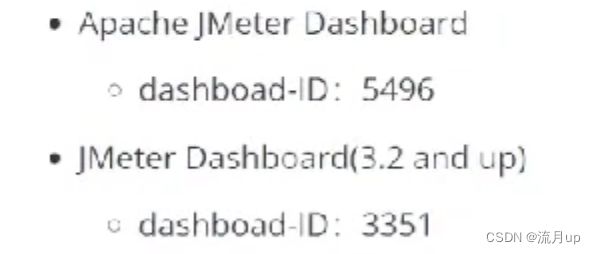
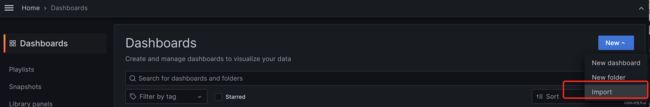
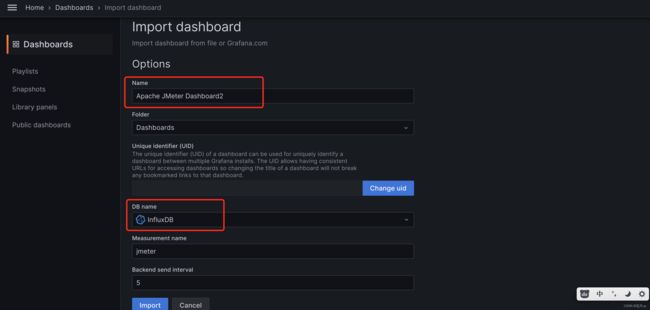
导入模板
模板导入分别有以下3种方式
- 直接输入模板 id 号
- 直接上传模板 json 文件
- 直接输入模板 json 内容
官网地址首页
官网dashboard
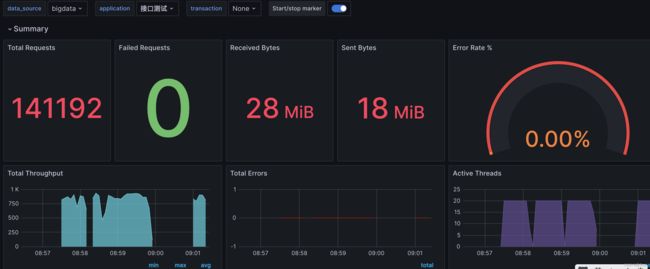
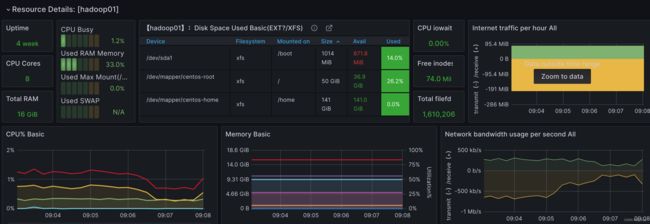
效果
导入另一个模板 json

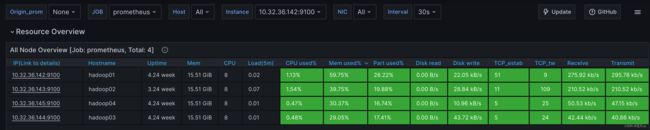
安装 node_exporter
下载地址
# 解压
mkdir /usr/local/soft
tar -zxvf node_exporter-0.18.1.linux-amd64.tar.gz -C /usr/local/soft/
# 启动
cd /usr/local/soft/node_exporter-0.18.1.linux-amd64
nohup ./node_exporter > node.log 2>&1 &
执行如下:
Last login: Thu Nov  2 13:07:44 2023 from 10.35.232.70
[root@hadoop04 ~]# mkdir /usr/local/soft
[root@hadoop04 ~]# tar -zxvf node_exporter-0.18.1.linux-amd64.tar.gz -C /usr/local/soft/
node_exporter-0.18.1.linux-amd64/
node_exporter-0.18.1.linux-amd64/node_exporter
node_exporter-0.18.1.linux-amd64/NOTICE
node_exporter-0.18.1.linux-amd64/LICENSE
[root@hadoop04 ~]# cd /usr/local/soft/node_exporter-0.18.1.linux-amd64
[root@hadoop04 node_exporter-0.18.1.linux-amd64]# nohup ./node_exporter > node.log 2>&1 &
[1] 9261
[root@hadoop04 node_exporter-0.18.1.linux-amd64]#
安装 prometheus
下载解压运行
下载地址
# 解压
tar -zxvf prometheus-2.15.1.linux-amd64.tar.gz -C /usr/local/soft/
cd /usr/local/soft/prometheus-2.15.1.linux-amd64
# 运行
nohup ./prometheus > prometheus.log 2>&1 &
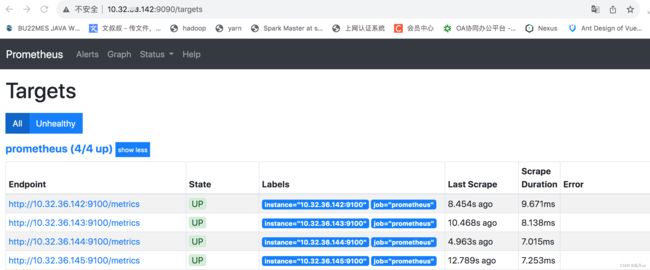
配置 prometheus
在 prometheus.yml 中加入如下配置:
scrape_configs:
  # The job name is added as a label `job=` to any timeseries scraped from this config.
  - job_name: 'prometheus'

    # metrics_path defaults to '/metrics'
    # scheme defaults to 'http'.

    static_configs:
    - targets: ['10.32.36.142:9090','10.32.36.143:9090','10.32.36.144:9090','10.32.36.145:9090']
[root@hadoop01 prometheus-2.15.1.linux-amd64]# netstat -nlp | grep 'prometheus'
[2]+  完成                  nohup ./prometheus > prometheus.log 2>&1
[root@hadoop01 prometheus-2.15.1.linux-amd64]# netstat -nlp | grep 'prometheus'
[root@hadoop01 prometheus-2.15.1.linux-amd64]# pwd
/usr/local/soft/prometheus-2.15.1.linux-amd64
[root@hadoop01 prometheus-2.15.1.linux-amd64]# ls
console_libraries  consoles  data  LICENSE  NOTICE  prometheus  prometheus.log  prometheus.yml  promtool  tsdb
[root@hadoop01 prometheus-2.15.1.linux-amd64]# vi prometheus.yml
问题
关于 grafana 安装出现的问题
能看到以前的数据,但不刷新,后来查看,linux 服务器时间与现实时间差了20多分钟,没办法,只能与现实时间同步一下。
结束
搭建压测可视化平台-如何离线完成至此就完成了,如有问题,欢迎评论区留言。