最小二乘法 - least sqaure method
一、最小二乘法的提出
最小二乘法是从日本那边引过来的,在日本又叫最小平方法。基本就是炒这位马同学的解释,闻道有先后。
如何理解最小二乘法?_马同学-CSDN博客_最小二乘法
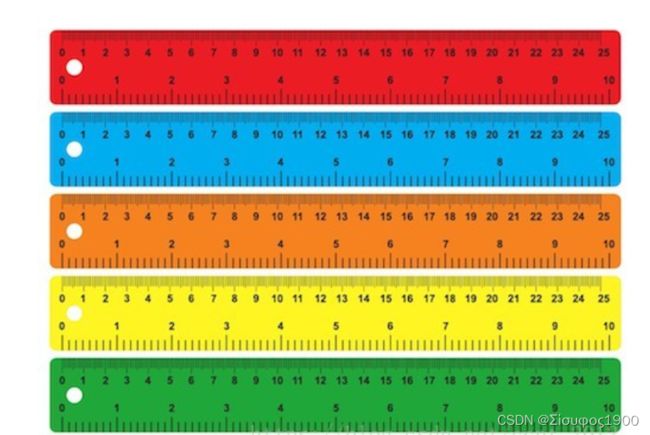
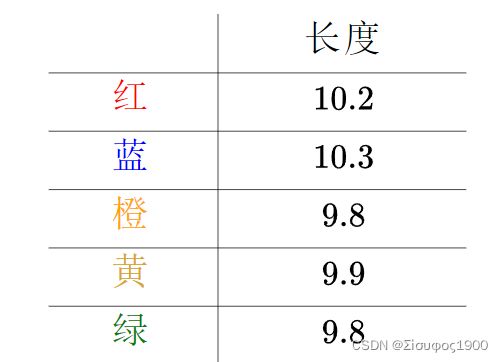
用它们来分别测量一线段的长度,得到的数值分别为(颜色指不同的尺子)
之所以出现不同的值可能因为:
-
不同厂家的尺子的生产精度不同
-
尺子材质不同,热胀冷缩不一样
-
测量的时候心情起伏不定
-
......
日常中就是这么使用的。可是作为很事'er的数学爱好者,自然要想下:
-
这样做有道理吗?
-
用调和平均数行不行?
-
用中位数行不行?
-
用几何平均数行不行?
二、最小二乘法
换一种思路来思考刚才的问题。
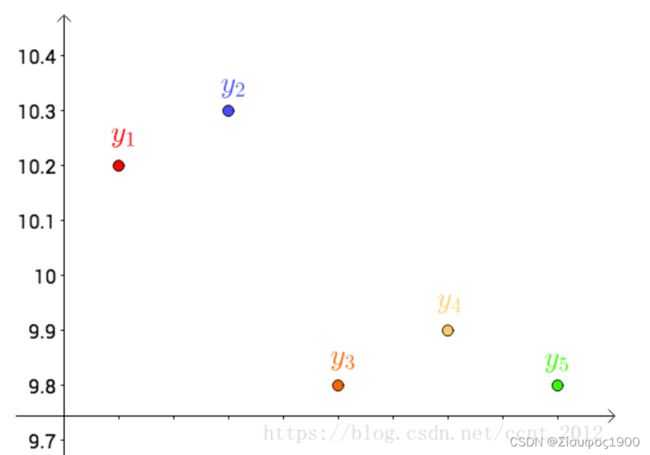
首先,把测试得到的值画在笛卡尔坐标系中,分别记作 yi:
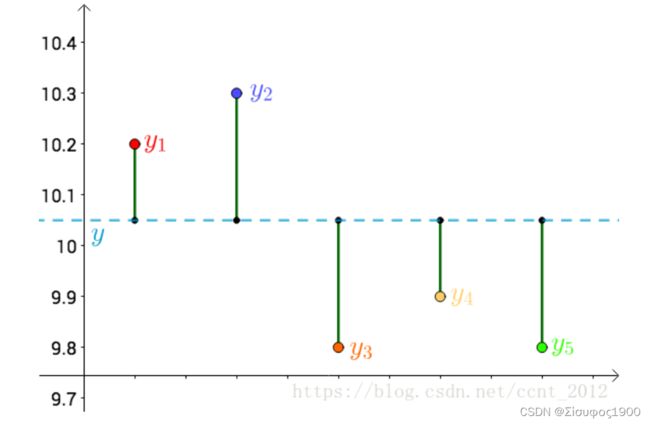
其次,把要猜测的线段长度的真实值用平行于横轴的直线来表示(因为是猜测的,所以用虚线来画),记作y :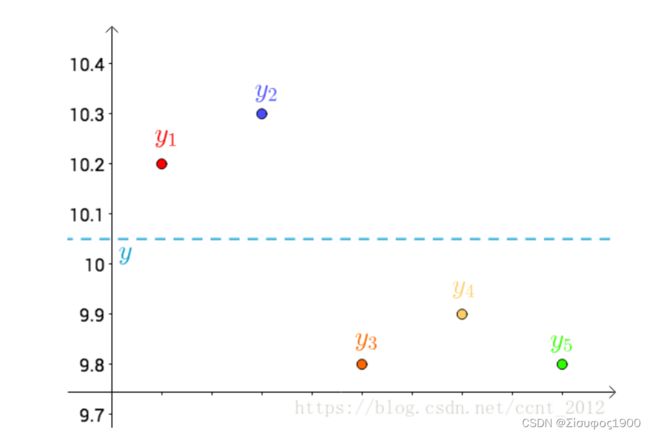
每个点都向 做垂线,垂线的长度就是 |y-yi|,也可以理解为测量值和真实值之间的误差:
二、最小二乘法
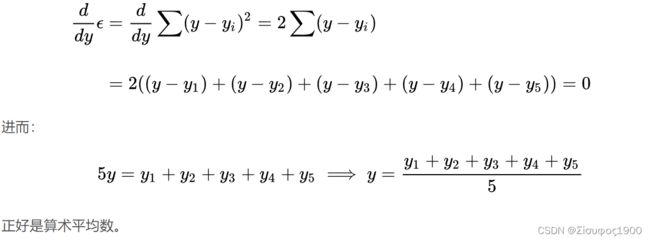
提出让总的误差的平方最小的y 就是真值,这是基于,如果误差是随机的,应该围绕真值上下波动(关于这点可以看下“如何理解无偏估计?”)。
这个猜想也蛮符合直觉的,来算一下。
这是一个二次函数,对其求导,导数为0的时候取得最小值:
推广
算术平均数只是最小二乘法的特例,适用范围比较狭窄。而最小二乘法用途就广泛。
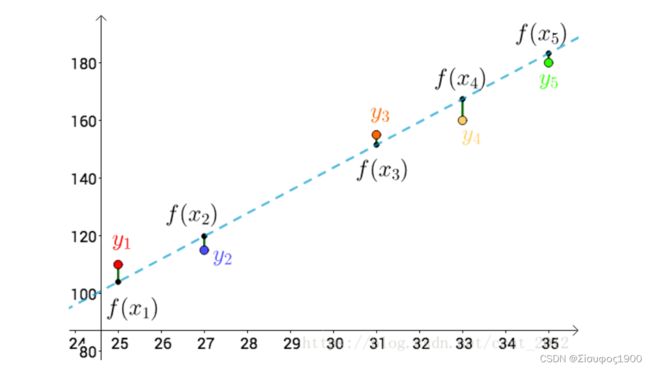
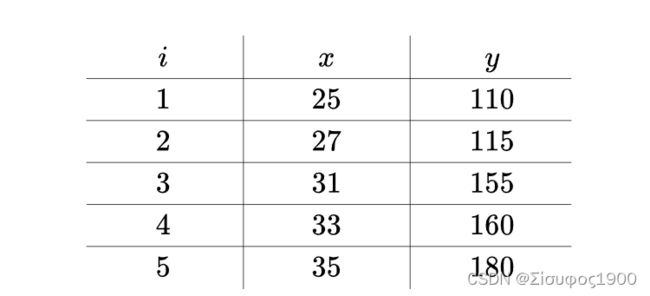
比如温度与冰淇淋的销量:
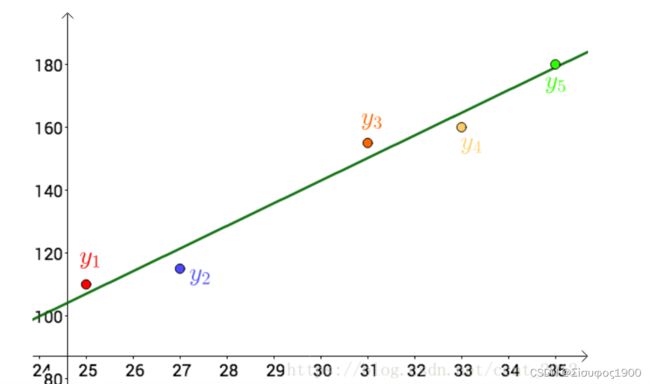
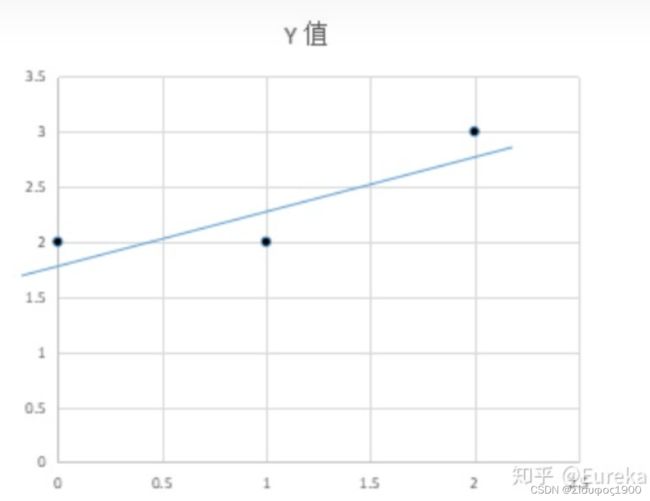
看上去像是某种线性关系:
可以假设这种线性关系为:f(x)=ax+b
其实,还可以假设:
在这个假设下,可以根据最小二乘法,可以求出a b c ,得到下面这根红色的二次曲线:
 同一组数据,选择不同的拟合方式 ,通过最小二乘法可以得到不一样的拟合曲线(出处):
![]()
三、最小二乘法的原理与要解决的问题
最小二乘法(least sqaure method) - 知乎
2 :最小二乘法的矩阵法解法、
矩阵法比代数法要简洁,且矩阵运算可以取代循环,所以现在很多书和机器学习库都是用的矩阵法来做最小二乘法。
多项式最小二乘法拟合的python代码实现 - 知乎
3:最小二乘法的几何解释
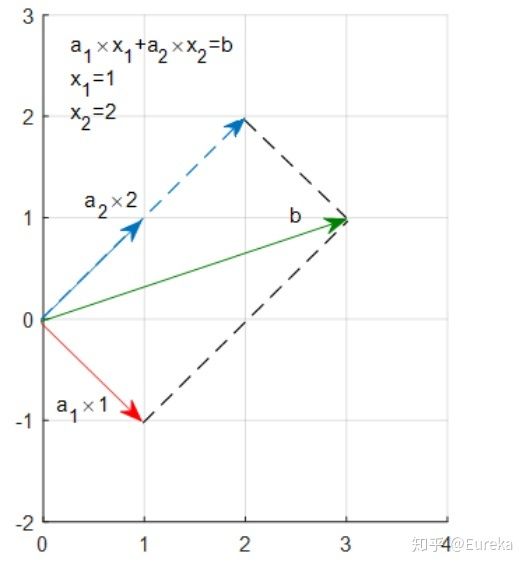
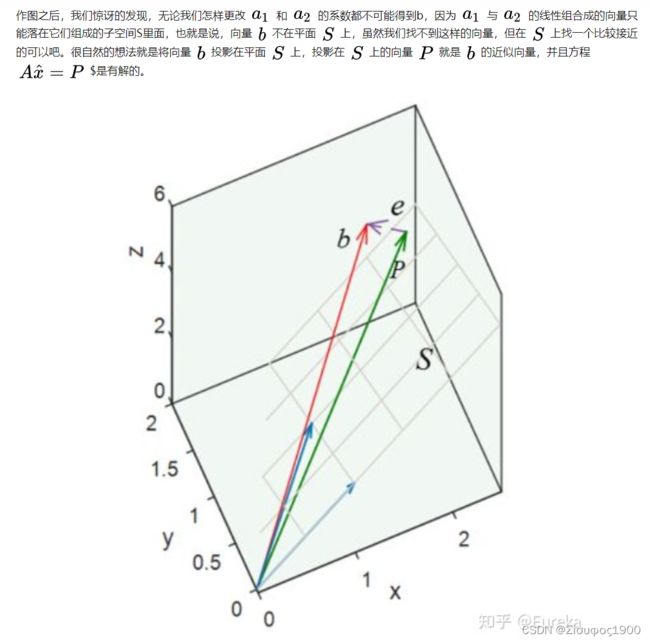
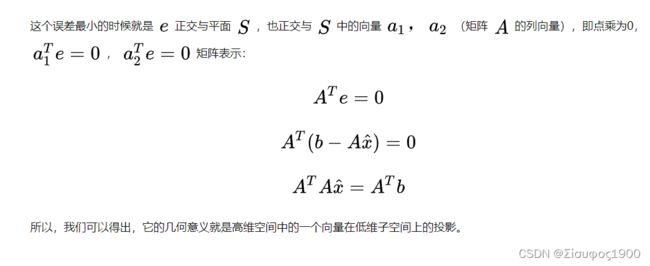
先说结论:最小二乘法的几何意义是高维空间中的一个向量在低维子空间的投影。
考虑这样一个简单的问题,求解二元一次方程组:
import numpy as np
import scipy as sp
from scipy.optimize import leastsq
import matplotlib.pyplot as plt

# target function
def real_func(x):
    return np.sin(2 * np.pi * x)

# fit function
def fit_func(p, x):
    """
    numpy.poly1d([1,2,3]) -> 1(x*x) + 2(x) + 3
    """
    f = np.poly1d(p)
    return f(x)

def residuals_func(p, x, y):
    res = fit_func(p, x) - y
    return res

def leastsq_mutifunc(x, y, m):
    """
    多项式最小二乘法实现
    :param x:输入
    :param y:目标输出
    :param m:多项式阶数
    :return:多项式系数
    """
    x = np.array(x)
    y = np.array(y)

    assert m <= x.shape[0], f"the number of m({m}) need less than x's size({x.shape[0]})"
    assert x.shape[0] == y.shape[0], f"the size of x({x.shape[0]}) must equal to y's size({y.shape[0]}"
    x_mat = np.zeros((x.shape[0], m+1))
    for i in range(x.shape[0]):
        x_mat_h = np.zeros((1, m+1))
        for j in range(m+1):
            x_mat_h[0][j] = x[i] ** (m-j)
        x_mat[i] = x_mat_h
    theta = np.dot(np.dot(np.linalg.inv(np.dot(x_mat.T, x_mat)), x_mat.T), y.T)
    return theta

def fitting(x, y, M=0):
    """
    :param M: 拟合目标函数的多项式次数
    :return: 多项式系数
    """
    # 初始化多项式系数
    p_init = np.random.rand(M + 1)
    # 最小二乘法
    my_p_lsq = leastsq_mutifunc(x, y, m=M)
    p_lsq = leastsq(residuals_func, p_init, args=(x, y))
    print(f'fitting parameters: {p_lsq[0]}, my fitting parameters: {my_p_lsq}')

    # 可视化
    x_points = np.linspace(np.min(x), np.max(x), int(x.shape[0] * 10000))
    plt.plot(x_points, real_func(x_points), label='real curve')
    plt.plot(x_points, fit_func(p_lsq[0], x_points), label='fitted curve')
    plt.plot(x_points, fit_func(my_p_lsq, x_points), label='my fitted curve')
    plt.plot(x, y, 'bo', label='noise curve')
    plt.legend()
    plt.show()
    return

if __name__ == '__main__':
    x = np.linspace(0, 1, 10)
    y_ = real_func(x)
    # noise
    y = [np.random.normal(0, 0.1) + y1 for y1 in y_]

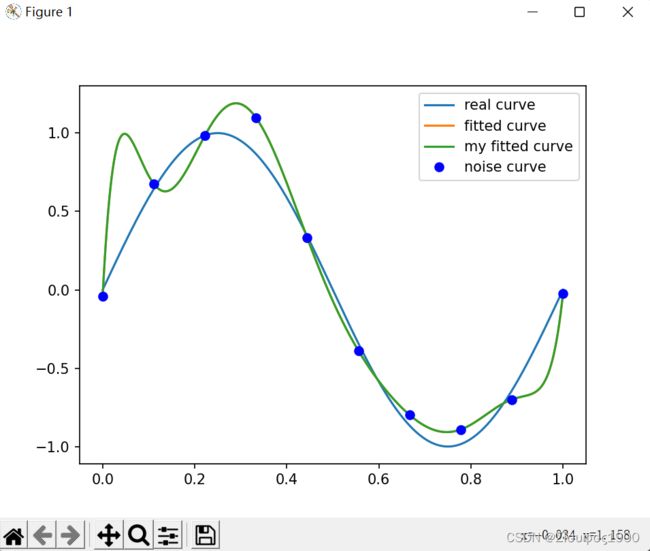
    p_lsq_0 = fitting(x, y, M=9)
    # theta = leastsq_mutifunc(x, y, 4)
    # print(theta)
