prometheus+grafana迅速搭建
前言
从0到1搭建prometheus+grafana监控,并实现邮件告警
不同版本之间配置格式可能有差异,本文使用的组件版本
Centos7 Linux version 3.10.0-1160.31.1.el7.x86_64
Node_exporter 0.25.0
Prometheus 2.37.6
Alertmanager 1.3.1
Grafana 9.4.7
下载链接 : prometheus-je7m
目录
-
-
- 0.参考与简介
- 1.下载与解压
- 2.注册为系统服务
- 3.启动
- 4.集成 node_exporter
- 5.集成 alertmanager(可选)
- 6.告警
-
- 6.1 配置告警规则
- 6.2 配置告警邮件(可选)
- 7 grafana配置(可选)
-
0.参考与简介
prometueus-alertmanager-node_exporter下载地址
node_exporter监控指标
极客时间-如何快速搭建Prometheus系统?
grafana下载地址
grafana大盘
虚拟机桥接网络配置
官网架构图:


1.下载与解压
mkdir -p /opt/prometheus && cd /opt/prometheus
# wget https://github.com/prometheus/prometheus/releases/download/v2.37.6/prometheus-2.37.6.linux-amd64.tar.gz
# wget https://github.com/prometheus/alertmanager/releases/download/v0.25.0/alertmanager-0.25.0.linux-amd64.tar.gz
# wget https://github.com/prometheus/node_exporter/releases/download/v1.3.1/node_exporter-1.3.1.linux-amd64.tar.gz
# wget https://dl.grafana.com/oss/release/grafana-9.4.7.linux-amd64.tar.gz
tar xf prometheus-2.37.6.linux-amd64.tar.gz
tar xf alertmanager-0.25.0.linux-amd64.tar.gz
tar xf node_exporter-1.3.1.linux-amd64.tar.gz
tar xf grafana-9.4.7.linux-amd64.tar.gz
mv prometheus-2.37.1.linux-amd64  prometheus
mv alertmanager-0.25.0.linux-amd64  alertmanager
mv node_exporter-1.3.1.linux-amd64  node_exporter
mv grafana-9.4.7 grafana
2.注册为系统服务
注册 prometheus 为服务
cat <<EOF >/etc/systemd/system/prometheus.service
[Unit]
Description="prometheus"
Documentation=https://prometheus.io/
After=network.target

[Service]
Type=simple

ExecStart=/opt/prometheus/prometheus/prometheus  --config.file=/opt/prometheus/prometheus/prometheus.yml --storage.tsdb.path=/opt/prometheus/prometheus/data --web.enable-lifecycle --enable-feature=remote-write-receiver --query.lookback-delta=2m --web.enable-admin-api

Restart=on-failure
SuccessExitStatus=0
LimitNOFILE=65536
StandardOutput=syslog
StandardError=syslog
SyslogIdentifier=prometheus


[Install]
WantedBy=multi-user.target
EOF

#启用服务
systemctl enable prometheus
##执行结果:Created symlink from /etc/systemd/system/multi-user.target.wants/prometheus.service to /etc/systemd/system/prometheus.service.


#启动命令解释
##--config.file=/opt/prometheus/prometheus.yml
#指定 Prometheus 的配置文件路径

##--storage.tsdb.path=/opt/prometheus/data
##指定 Prometheus 时序数据的硬盘存储路径--web.enable-lifecycle启用生命周期管理相关的 API,比如调用 /-/reload 接口就需要启用该项

##--enable-feature=remote-write-receiver
##启用 remote write 接收数据的接口,启用该项之后,categraf、grafana-agent 等 agent 就可以通过 /api/v1/write 接口推送数据给 Prometheus

##--query.lookback-delta=2m
##即时查询在查询当前最新值的时候,只要发现这个参数指定的时间段内有数据,就取最新的那个点返回,这个时间段内没数据,就不返回了

##--web.enable-admin-api
##启用管理性 API,比如删除时间序列数据的 /api/v1/admin/tsdb/delete_series 接口
注册 alertmanager 为服务
cat <<EOF >/etc/systemd/system/alertmanager.service
[Unit]
Description="alertmanager"
After=network.target

[Service]
Type=simple

ExecStart=/opt/prometheus/alertmanager/alertmanager
WorkingDirectory=/opt/prometheus/alertmanager

Restart=on-failure
SuccessExitStatus=0
LimitNOFILE=65536
StandardOutput=syslog
StandardError=syslog
SyslogIdentifier=alertmanager


[Install]
WantedBy=multi-user.target
EOF

#启用服务
systemctl enable alertmanager
##执行结果:Created symlink from /etc/systemd/system/multi-user.target.wants/alertmanager.service to /etc/systemd/system/alertmanager.service.
注册 node_explorer 为服务
cat <<EOF >/etc/systemd/system/node_exporter.service
[Unit]
Description="node_exporter"
After=network.target

[Service]
Type=simple

ExecStart=/opt/prometheus/node_exporter/node_exporter
WorkingDirectory=/opt/prometheus/node_exporter

Restart=on-failure
SuccessExitStatus=0
LimitNOFILE=65536
StandardOutput=syslog
StandardError=syslog
SyslogIdentifier=node_exporter


[Install]
WantedBy=multi-user.target
EOF

#启用服务
systemctl enable node_exporter
##执行结果:Created symlink from /etc/systemd/system/multi-user.target.wants/node_exporter.service to /etc/systemd/system/node_exporter.service.
注册 grafana 为服务
cat <<EOF >/etc/systemd/system/grafana.service
[Unit]
Description="grafana"
After=network.target

[Service]
Type=simple

ExecStart=/opt/prometheus/grafana/bin/grafana-server
WorkingDirectory=/opt/prometheus/grafana

Restart=on-failure
SuccessExitStatus=0
LimitNOFILE=65536
StandardOutput=syslog
StandardError=syslog
SyslogIdentifier=grafana


[Install]
WantedBy=multi-user.target
EOF

#启用服务
systemctl enable grafana
##执行结果:Created symlink from /etc/systemd/system/multi-user.target.wants/grafana.service to /etc/systemd/system/grafana.service.
3.启动
#prometheus  启动 停止 运行状态 重启
systemctl start prometheus
systemctl stop prometheus
systemctl status prometheus
systemctl restart prometheus
http://服务器IP:9090
#alertmanager
systemctl start alertmanager
systemctl stop alertmanager
systemctl status alertmanager
systemctl restart alertmanager
http://服务器IP:9093
#node_exporter
systemctl start node_exporter
systemctl stop node_exporter
systemctl status node_exporter
systemctl restart node_exporter
http://服务器IP:9100
#grafana
systemctl start grafana
systemctl stop grafana
systemctl status grafana
systemctl restart grafana
http://服务器IP:3000    admin/admin
4.集成 node_exporter
4.1 prometheus接入node_exporter
prometheus.yml
#追加job node_exporter

scrape_configs:
  - job_name: 'prometheus'
    static_configs:
    - targets: ['localhost:9090']

  - job_name: 'node_exporter'
    static_configs:
    - targets: ['localhost:9100']
5.集成 alertmanager(可选)
5.1 prometheus 接入 alertmanager
prometheus.yml
#prometheus.yml 注意alertmanager:9093这里是让改成ip的,不改则alertmanager配置不生效
# Alertmanager configuration
alerting:
  alertmanagers:
    - static_configs:
        - targets:
          - "localhost:9093"
          # - "alertmanager:9093"
5.2告警邮件配置 alertmanager.yml
global:
  # 发送者邮箱地址
  smtp_from: '【发件人】'
  # 邮箱smtp服务器地址及端口
  smtp_smarthost: '【发件邮箱smtp服务器地址:端口】'
  # 发送者邮箱账号
  smtp_auth_username: '【发件邮箱账号】'
  # 发送者邮箱密码,这里填入邮箱的SMTP授权码
  smtp_auth_password: '【发件邮箱smtp授权码】'
  #是否使用tls
  smtp_require_tls: false
# 路由配置,设置报警的分发策略,它是一个树状结构,按照深度优先从左向右的顺序进行匹配。
route:
  # 用于将传入警报分组在一起的标签。
  # 基于告警中包含的标签,如果满足group_by中定义标签名称,那么这些告警将会合并为一个通知发送给接收器。
  group_by: ['alertname']
  # 发送通知的初始等待时间
  group_wait: 3s #30s
  # 在发送有关新警报的通知之前需要等待多长时间
  group_interval: 5s #1m
  # 如果已发送通知,则在再次发送通知之前要等待多长时间,通常约3小时或更长时间
  repeat_interval: 10s #1h
  # 接收者名称
  receiver: 'email'

receivers:
  - name: 'web.hook'
    webhook_configs:
      - url: 'http://127.0.0.1:5001/'

  - name: 'email'
    email_configs:
    - to: '【收件人邮箱地址】'

inhibit_rules:
  - source_match:
      severity: 'critical'
    target_match:
      severity: 'warning'
    equal: ['alertname', 'dev', 'instance']
5.3 重启 alertmanager ,并让 prometheus 重新加载配置
systemctl restart alertmanager
kill -HUP `pidof prometheus`
prometheus.yml 最终完整文件(注意版本不同格式会有调整,版本为)
# my global config
global:
  scrape_interval: 15s # Set the scrape interval to every 15 seconds. Default is every 1 minute.
  evaluation_interval: 15s # Evaluate rules every 15 seconds. The default is every 1 minute.
  # scrape_timeout is set to the global default (10s).

# Alertmanager configuration
alerting:
  alertmanagers:
    - static_configs:
        - targets:
          - "localhost:9093"
          # - "alertmanager:9093"

# Load rules once and periodically evaluate them according to the global 'evaluation_interval'.
rule_files:
  - "demoRule.yml"
  # - "first_rules.yml"
  # - "second_rules.yml"

# A scrape configuration containing exactly one endpoint to scrape:
# Here it's Prometheus itself.
scrape_configs:
  # The job name is added as a label `job=` to any timeseries scraped from this config.
  - job_name: "prometheus"

    # metrics_path defaults to '/metrics'
    # scheme defaults to 'http'.

    static_configs:
      - targets: ["localhost:9090"]


  - job_name: 'node_exporter'
    static_configs:
    - targets: ['localhost:9100']
6.告警
6.1 配置告警规则
需要集成
node_exorter配置后,
prometheus的Rules可识别到告警规则,Alerts可以正常触发告警
6.1.1 配置 prometheus.yml
rule_files:
  - "demoRule.yml"
  # - "first_rules.yml"
  # - "second_rules.yml"
- 1.2 创建
demoRule.yml放在prometheus.yml同目录下即可
#监控 Node-Exporter 挂掉以及内存使用率超过 1%
groups:
- name: node_exporter
  rules:
  - alert: HostDown
    expr: up{job="node_exporter"} == 0
    for: 10s #1m
    labels:
      severity: critical
    annotations:
      summary: Host down {{ $labels.instance }}
  - alert: MemUtil
    expr: 100 - node_memory_MemAvailable_bytes / node_memory_MemTotal_bytes * 100 > 1
    for: 10s #1m
    labels:
      severity: warn
    annotations:
      summary: Mem usage larger than 1%, instance:{{ $labels.instance }}
6.1.3 让 prometheus 重新加载配置
kill -HUP `pidof prometheus`
6.1.4 prometheus 界面

6.1.5 引发告警条件
按照配置的告警规则主动触发
针对
CPU使用率高于1%,可以做一些解压、启动之类的操作针对
node_explorer 宕机,可以主动关闭node_explorer
6.1.6 prometheus Alerts告警界面 成功触发

6.2 配置告警邮件(可选)
需要集成
alertmanager配置后,邮箱即可收到邮件
6.2.1prometheus 触发告警,并发送给 alertmanager

6.2.2 alertManager 界面收到告警
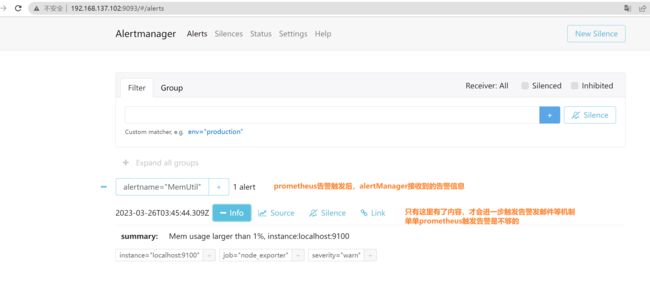
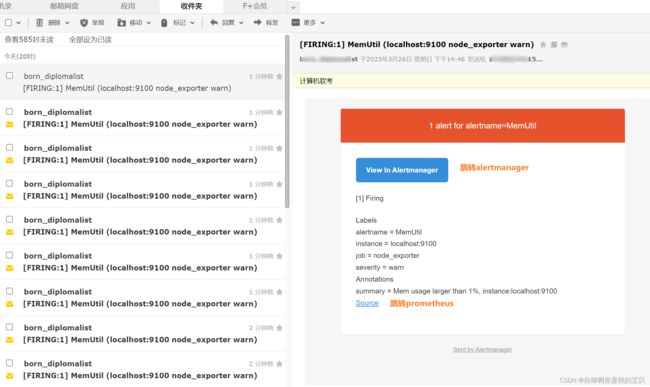
6.2.3 在alertmanager接收到消息后,成功触发了发送邮件
自己测试指标调整过低的话建议用完就关掉,不然会因频繁触发导致发很多的邮件
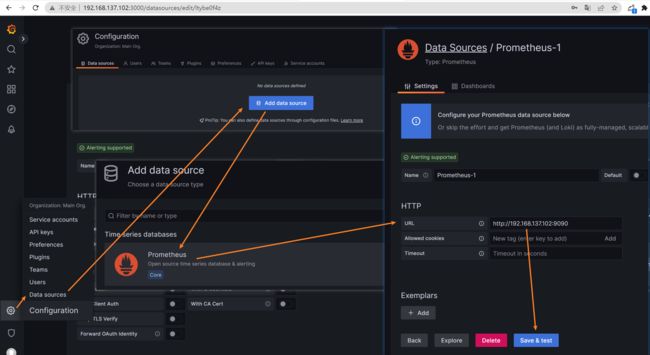
7 grafana配置(可选)
grafana添加 proemetheus 数据源
grafana 导入 node_explorer 大盘 (可以去 这里 找别人分析的大盘)

导入后大盘效果
