基本数字图像处理
一、环境配置(采用Anaconda虚拟环境jupyter notebook)
1.1、基本包的安装
!pip install numpy
!pip install matplotlib
!pip install scikit-image
!pip install opencv-python
!pip install opencv-contrib-python
1.1、查看安装的包
import numpy as np
import matplotlib
import skimage
import cv2
print("NumPy version:", np.__version__)
print("Matplotlib version:", matplotlib.__version__)
print("scikit-image version:", skimage.__version__)
print("OpenCV (opencv-python) version:", cv2.__version__)
NumPy version: 1.24.4
Matplotlib version: 3.7.3
scikit-image version: 0.21.0
OpenCV (opencv-python) version: 4.8.1
二、图片的载入、展示、存储
2.1图片的载入和展示
import numpy as np
import matplotlib.pyplot as plt
import cv2
import skimage
import skimage.io as io   #图片的载入使用cv2进行载入
plt.rcParams['font.sans-serif'] = 'SimHei'

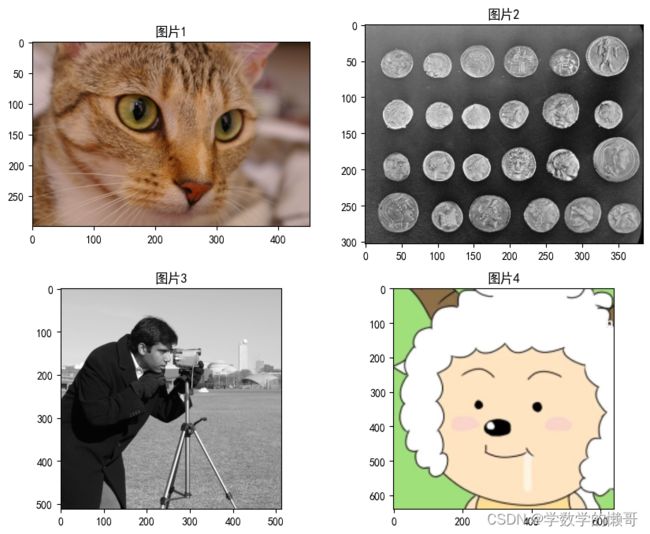
img1 = skimage.data.chelsea()
img2 = skimage.data.coins()   #单通道的读取的图片
img3 = skimage.data.camera()
img4 = cv2.imread("yang.jpg")

img4 = cv2.cvtColor(img4, cv2.COLOR_BGR2RGB)  #OpenCV默认将图像解释为BGR(蓝绿红)颜色通道顺序需要进行调整
imgs = [img1,img2,img3,img4]
num = 0
plt.figure(figsize=(10, 8))
for img in imgs:       #图片的展示一共4张图片3个为skimage数据集里面的图、1个本人头像采用cv2读入
    num +=1
    plt.subplot(2,2,num)
    plt.imshow(img,cmap='gray')  #图二图三是灰度图需要采用灰度映射输出
    plt.title("图片%d"%num)
    io.imsave("..\Experiment1\Dat\image_save\image%d.jpg"%num, img)      #图片的存储
2.2图片的基本信息输出和灰度变换
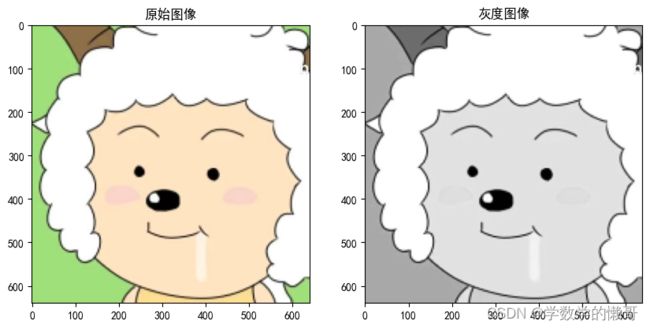
plt.rcParams['font.sans-serif'] = 'SimHei'  #设置中文显示
# 打印图像的形状
for img in [img1,img4]:
    print("原始图像的形状:", img.shape)
    print("最大像素值:", np.max(img))
    print("最小像素值:", np.min(img))
    print("平均像素值:", np.mean(img))
    img_s = img[50:150, 100:200,:]
    print("子区域的形状:", img_s.shape)
    plt.figure(figsize=(10, 5))
    img_gray=np.mean(img,2)
    # 在第一个子图中显示原始图像
    plt.subplot(1, 2, 1)
    plt.imshow(img)
    plt.title("原始图像")
    # 在第二个子图中显示灰度图像
    plt.subplot(1, 2, 2)
    plt.imshow(img_gray, cmap='gray')  # 使用灰度色彩映射
    plt.title("灰度图像")
    # 显示图像
    plt.show()
原始图像的形状: (300, 451, 3)
最大像素值: 231
最小像素值: 0
平均像素值: 115.30514166050752
子区域的形状: (100, 100, 3)
原始图像的形状: (640, 640, 3)
最大像素值: 255
最小像素值: 0
平均像素值: 218.49665690104166
子区域的形状: (100, 100, 3)
2.3图像的展示之灰度图像、HSV图像、RGB图像
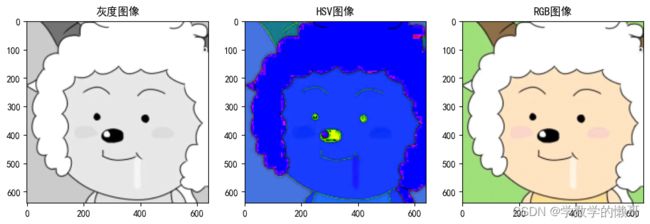
import skimage.color
for img in [img1,img4]:
    # 将原始彩色图像转换为灰度图像
    img_gray = skimage.color.rgb2gray(img)
    plt.figure(figsize=(12, 6));plt.subplot(1, 3, 1);plt.imshow(img_gray, cmap='gray');plt.title("灰度图像")
    # 将原始彩色图像转换为HSV颜色空间
    img_hsv = skimage.color.rgb2hsv(img);plt.subplot(1, 3, 2);plt.imshow(img_hsv);plt.title("HSV图像")
    # 将HSV图像转换回RGB颜色空间
    img_r = skimage.color.hsv2rgb(img_hsv);plt.subplot(1, 3, 3);plt.imshow(img_r);plt.title("RGB图像")
    plt.show()
1.4图像的不同格式存储和图像的编码类型
import numpy as np
import matplotlib.pyplot as plt
import cv2
import skimage
import skimage.io as io   #图片的载入使用cv2进行载入
plt.rcParams['font.sans-serif'] = 'SimHei'
img4 = cv2.imread("yang.jpg")
img4_rgb = cv2.cvtColor(img4, cv2.COLOR_BGR2RGB)
img1 = skimage.data.chelsea()
img2 = skimage.data.coins()   #单通道的读取的图片
img3 = skimage.data.camera()
img4 = cv2.imread("yang.jpg")
print(img1.dtype)
print(img2.dtype)
print(img3.dtype)
print(img4.dtype)
io.imsave("..\Experiment1\Dat\output_image\img1.png",img1)#存储为png类型
io.imsave("..\Experiment1\Dat\output_image\img2.jpg",img2)#存储为jpg类型
io.imsave("..\Experiment1\Dat\output_image\img3.bmp",img3)#存储为bmp类型
io.imsave("..\Experiment1\Dat\output_image\img4.tiff",img4)#存储为tiff类型
uint8
uint8
uint8
uint8
三、展示图片的数字矩阵和RGB三通道的转变
3.1展示图片的数字矩阵格式
import cv2
import numpy as np
import matplotlib.pyplot as plt

#img_p1 = cv2.imread('image1.jpg')
img_p2 = cv2.imread("yang.jpg")
for img_p in [img_p2]:
    img_rgb = cv2.cvtColor(img_p, cv2.COLOR_BGR2RGB)
    print("RGB图片的三维数字矩阵输出:")
    print(img_rgb)

    # 分离颜色通道
    red_channel = img_rgb[:, :, 0]
    print("图片的红色通道数字矩阵输出:")
    print(red_channel)

    green_channel = img_rgb[:, :, 1]
    print("图片的绿色通道数字矩阵输出:")
    print(green_channel)

    blue_channel = img_rgb[:, :, 2]
    print("图片的蓝色通道数字矩阵输出:")
    print(red_channel)
RGB图片的三维数字矩阵输出:
[[[ 65 108  36]
  [ 65 108  36]
  [ 65 108  36]
  ...
  [ 60 109  43]
  [ 62 109  41]
  [ 62 109  41]]

 [[168 214 139]
  [168 215 137]
  [168 214 139]
  ...
  [165 216 141]
  [167 215 139]
  [167 215 139]]

 [[165 219 135]
  [165 219 133]
  [165 219 135]
  ...
  [165 220 127]
  [166 220 126]
  [166 220 126]]

 ...

 [[159 224 122]
  [159 224 122]
  [159 224 122]
  ...
  [159 224 122]
  [159 224 122]
  [159 224 122]]

 [[159 224 122]
  [159 224 122]
  [159 224 122]
  ...
  [159 224 122]
  [159 224 122]
  [159 224 122]]

 [[159 224 122]
  [159 224 122]
  [159 224 122]
  ...
  [159 224 122]
  [159 224 122]
  [159 224 122]]]
图片的红色通道数字矩阵输出:
[[ 65  65  65 ...  60  62  62]
 [168 168 168 ... 165 167 167]
 [165 165 165 ... 165 166 166]
 ...
 [159 159 159 ... 159 159 159]
 [159 159 159 ... 159 159 159]
 [159 159 159 ... 159 159 159]]
图片的绿色通道数字矩阵输出:
[[108 108 108 ... 109 109 109]
 [214 215 214 ... 216 215 215]
 [219 219 219 ... 220 220 220]
 ...
 [224 224 224 ... 224 224 224]
 [224 224 224 ... 224 224 224]
 [224 224 224 ... 224 224 224]]
图片的蓝色通道数字矩阵输出:
[[ 65  65  65 ...  60  62  62]
 [168 168 168 ... 165 167 167]
 [165 165 165 ... 165 166 166]
 ...
 [159 159 159 ... 159 159 159]
 [159 159 159 ... 159 159 159]
 [159 159 159 ... 159 159 159]]
3.2图像的RGB三通道图像单独输出
import cv2
import numpy as np
import matplotlib.pyplot as plt
img_p1 = cv2.imread('..\Experiment1\Dat\output_image\img1.png')  # 读取图像文件
img_p2 = cv2.imread("yang.jpg")
for img_p in [img_p1,img_p2]:
    # 将BGR颜色空间转换为RGB颜色空间
    img_rgb = cv2.cvtColor(img_p, cv2.COLOR_BGR2RGB)
    # 分离颜色通道
    red_channel = img_rgb[:, :, 0]
    green_channel = img_rgb[:, :, 1]
    blue_channel = img_rgb[:, :, 2]
    # 显示红色通道
    plt.figure(figsize=(10, 10))
    plt.subplot(1, 3, 1)
    plt.imshow(red_channel, cmap='Reds')  # 使用'Reds'颜色映射来显示红色通道
    plt.title('Red Channel')
    plt.axis('off')
    # 显示绿色通道
    plt.subplot(1, 3, 2)
    plt.imshow(green_channel, cmap='Greens')  # 使用'Greens'颜色映射来显示绿色通道
    plt.title('Green Channel')
    plt.axis('off')
    # 显示蓝色通道
    plt.subplot(1, 3, 3)
    plt.imshow(blue_channel, cmap='Blues')  # 使用'Blues'颜色映射来显示蓝色通道
    plt.title('Blue Channel')
    plt.axis('off')
    plt.show()
3.3不同命令展示图片
import matplotlib.pyplot as plt
import matplotlib.image as mpimg
import cv2
#使用matplotlib加载和展示图片
img = mpimg.imread("yang.jpg")
plt.imshow(img)
plt.show()
#使用cv2加载和展示图片
img = cv2.imread("yang.jpg")
cv2.imshow('图片', img)
cv2.waitKey(0)
#cv2.destroyAllWindows()
from PIL import Image
#使用Pillow加载和展示图片
img = Image.open("yang.jpg")
img.show()
#使用jupyternotebook加载和展示图片  (最慢)
from IPython.display import Image
Image(filename="yang.jpg")
四、在图片上绘制形状
4.1自建空白画布绘图形(使用PIL)
from PIL import Image, ImageDraw
import matplotlib.pyplot as plt
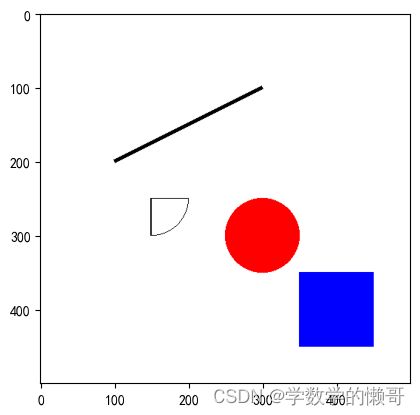
img = Image.new('RGB', (500, 500), 'white')
draw = ImageDraw.Draw(img)
# 绘制一个红色圆形,圆心位置为(250, 250),半径为100
draw.ellipse((250, 250, 250+100, 250+100), fill='red')
# 绘制一个蓝色正方形,左上角位置为(350, 350),边长为100
draw.rectangle((350, 350, 350+100, 350+100), fill='blue')
# 绘制一条直线,起点为(400, 400),终点为(450, 450),线宽为5
draw.line((100, 200, 300, 100), fill='black', width=5)
# 绘制一条曲线,起点为(100, 200),终点为(200, 300)
draw.pieslice([100, 200,200, 300], start=0, end=90, outline=True)
# 将图像显示在Matplotlib中
plt.imshow(img)
plt.show()
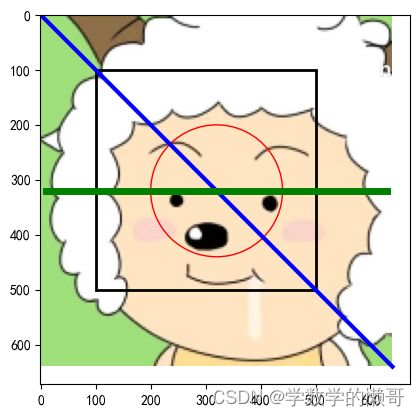
4.2在图片上绘制形状(使用cv2)
import cv2 as cv
def draw_line():
    # 读取图片
    img = cv.imread("yang.jpg")
    # 获取图像的高度、宽度和通道数
    h, w, c = img.shape
    # 绘制一条蓝色线,起点(0,0),终点(w*2,h*2),线宽10
    img = cv.line(img, (0, 0), (w * 2, h * 2), (255, 0, 0), 10)
    # 绘制一条绿色线,起点(10, 图像高度的一半),终点(w - 10, 图像高度的一半),线宽5
    img = cv.line(img, (10, int(h / 2)), (w - 10, int(h / 2)), (0, 255, 0), 5)
    # 绘制一个红色圆,中心在图像中央,半径为30
    img = cv.circle(img, (w // 2, h // 2), 200, (0, 0, 255), 0)  # -1 表示填充
    # 绘制一个矩形,左上角和右下角坐标分别为(100, 100)和(400, 400)
    img = cv.rectangle(img, (100, 100), (400, 400), (0, 0, 0), 2)
    cv.imshow('line', img)
    cv.waitKey(0)
    cv.destroyAllWindows()
draw_line()
4.3在图片上绘制形状(使用matplotlib)
import matplotlib.pyplot as plt
import matplotlib.patches as patches

def draw_shapes_with_matplotlib():
    # 读取图片
    img = plt.imread("yang.jpg")
    # 创建一个图形和子图
    fig, ax = plt.subplots()
    ax.imshow(img)
    # 绘制一条蓝色线
    ax.plot([0, img.shape[1]], [0, img.shape[0]], 'b', linewidth=3)
    # 绘制一条绿色线
    ax.plot([10, img.shape[1] - 10], [img.shape[0] / 2, img.shape[0] / 2], 'g', linewidth=5)
    # 绘制一个蓝色圆
    circle = patches.Circle((img.shape[1] / 2, img.shape[0] / 2), 120, color='red', fill=False)
    ax.add_patch(circle)
    # 绘制一个矩形
    rectangle = patches.Rectangle((100, 100), 400, 400, linewidth=2, edgecolor='black', facecolor='none')
    ax.add_patch(rectangle)
    # 显示图像
    plt.show()
# 调用绘制图形的函数
draw_shapes_with_matplotlib()
4.4在图片上绘制形状(使用PIL)
from PIL import Image, ImageDraw
def draw_shapes_with_pillow():
    # 读取图片
    img = Image.open("yang.jpg")
    # 创建绘图对象
    draw = ImageDraw.Draw(img)
    # 绘制一条蓝色线
    draw.line([(0, 0), (img.width * 2, img.height * 2)], fill=(0, 0, 255), width=10)
    # 绘制一条绿色线
    draw.line([(10, img.height / 2), (img.width - 10, img.height / 2)], fill=(0, 255, 0), width=5)
    # 绘制一个蓝色圆
    draw.ellipse((img.width / 2 - 120, img.height / 2 - 120, img.width / 2 + 120, img.height / 2 + 120), fill=(0, 0, 255))
    # 绘制一个矩形
    draw.rectangle((100, 100, 200, 200), outline=(0, 0, 0))
    # 显示图像
    img.show()
# 调用绘制图形的函数
draw_shapes_with_pillow()
五、利用skimage的transform模块对图片进行形变处理
5.1使用cv2实现对图片的缩放,旋转,亮度变化
import cv2 as cv
import numpy as np

def image_transform_with_opencv():
    img = cv.imread("yang.jpg")
    # 缩放图像,可以调整缩放比例,这里是将图像宽高都缩小为原来的一半
    scaled_img = cv.resize(img, (0, 0), fx=0.5, fy=0.5)

    # 旋转图像,可以调整旋转角度
    rotation_matrix = cv.getRotationMatrix2D((img.shape[1] / 2, img.shape[0] / 2), 45, 1)
    rotated_img = cv.warpAffine(img, rotation_matrix, (img.shape[1], img.shape[0]))

    # 改变亮度,可以调整亮度增益
    brightness = 50  # 调整亮度增益
    brightened_img = np.clip(cv.addWeighted(img, 1, np.zeros(img.shape, dtype=img.dtype), 0, brightness), 0, 255)

    # 显示不同处理后的图像
    cv.imshow('Original', img)
    cv.imshow('Scaled', scaled_img)
    cv.imshow('Rotated', rotated_img)
    cv.imshow('Brightened', brightened_img)

    cv.waitKey(0)
    cv.destroyAllWindows()

# 调用图像变换的函数
image_transform_with_opencv()
4.2使用PIL实现对图片的缩放,旋转,亮度变化(比较低效会使用WPS打开)
from PIL import Image, ImageEnhance, ImageOps
def image_transform_with_pillow():
    img = Image.open("yang.jpg")

    # 缩放图像,可以调整缩放比例
    scaled_img = img.resize((img.width // 2, img.height // 2))

    # 旋转图像,可以调整旋转角度
    rotated_img = img.rotate(45)

    # 改变亮度,可以调整亮度增益
    brightness_factor = 1.5  # 调整亮度增益
    enhancer = ImageEnhance.Brightness(img)
    brightened_img = enhancer.enhance(brightness_factor)

    # 显示不同处理后的图像
    img.show(title='Original')
    scaled_img.show(title='Scaled')
    rotated_img.show(title='Rotated')
    brightened_img.show(title='Brightened')

image_transform_with_pillow()
4.3使用skimage的transform模块对图片进行形变处理,实现图片的缩放,旋转和亮度变化
import numpy as np
import matplotlib.pyplot as plt
from skimage import io, transform, exposure

# 读取图像
image = io.imread("yang.jpg")
# 缩放图像
scaled_image=transform.resize(image, (200, 200))

# 旋转图像
rotated_image = transform.rotate(image, 45, resize=True, mode='constant')
# 改变亮度
brightened_image = exposure.adjust_gamma(image, gamma=1.5)

# 显示不同处理后的图像
plt.figure(figsize=(12, 4))
plt.subplot(141)
plt.imshow(image)
plt.title('原始图像')

plt.subplot(142)
plt.imshow(scaled_image)
plt.title('缩放图像')

plt.subplot(143)
plt.imshow(rotated_image)
plt.title('旋转图像')

plt.subplot(144)
plt.imshow(brightened_image)
plt.title('亮度增强')

plt.show()
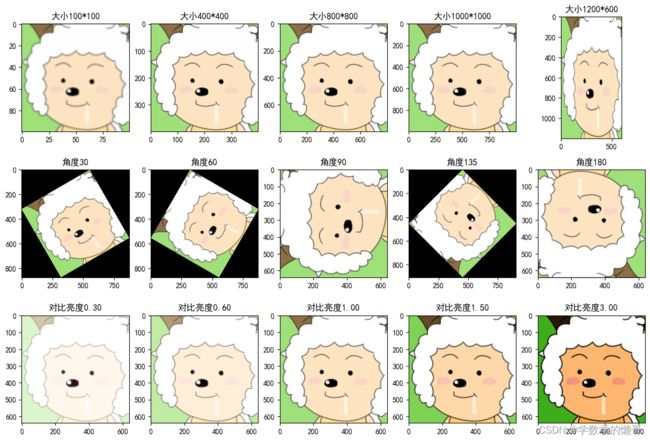
5.4调参数对比实验
import numpy as np
import matplotlib.pyplot as plt
from skimage import io, transform, exposure

# 读取图像
image = io.imread("yang.jpg")

# 缩放图像
scaled_image = []
size = [(100,100),(400,400),(800,800),(1000,1000),(1200,600)]
for x,y in  size:
    tep = transform.resize(image, (x, y))
    scaled_image.append(tep)

# 旋转图像
rotated_image = []
theta = [30,60,90,135,180]
for k in theta:
    tep = transform.rotate(image, k, resize=True, mode='constant')
    rotated_image.append(tep)

# 改变亮度
brightened_image = []
gm = [0.3,0.6,1.0,1.5,3.0]
for g in gm:
    tep = exposure.adjust_gamma(image, gamma=g)
    brightened_image.append(tep)

# 显示不同处理后的图像
plt.figure(figsize=(15, 10))

for i in range(1,6):
    plt.subplot(3,5,i)
    plt.imshow(scaled_image[i-1])
    plt.title("大小%d*%d"%(size[i-1][0],size[i-1][1]))

for i in range(1,6):
    plt.subplot(3,5,i+5)
    plt.imshow(rotated_image[i-1])
    plt.title("角度%d"%(theta[i-1]))

for i in range(1,6):
    plt.subplot(3,5,i+10)
    plt.imshow(brightened_image[i-1])
    plt.title("对比亮度%.2f"%(gm[i-1]))

plt.show()
