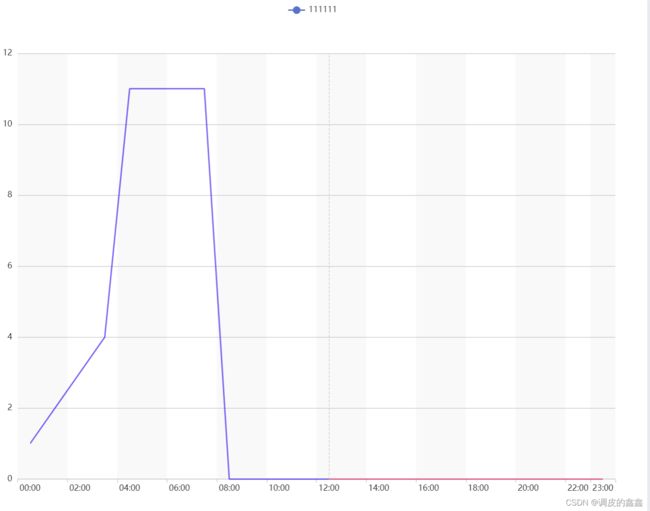
【echarts】按照X轴范围展示不同的颜色
效果
function run() {
  var data = {
    timeList: [
      '00:00',
      '01:00',
      '02:00',
      '03:00',
      '04:00',
      '05:00',
      '06:00',
      '07:00',
      '08:00',
      '09:00',
      '10:00',
      '11:00',
      '12:00',
      '13:00',
      '14:00',
      '15:00',
      '16:00',
      '17:00',
      '18:00',
      '19:00',
      '20:00',
      '21:00',
      '22:00',
      '23:00'
    ],
    performanceList: [
      1, 2, 3, 4, 11, 11, 11,11, 0, 0, 0, 0, 0, 0, 0, 0, 0, 0, 0, 0, 0, 0, 0, 0
    ]
  };
  var predictNum = 12;
  var series = [{
    name: '111111',
    type: 'line',
    data: data.performanceList,
    symbolSize: 'none',
    symbol: 'circle',
    markLine: {
      silent: true,
      symbol: ['none', 'none'],
      lineStyle: {
        color: '#ccc'
      },
      animation: false,
      label: {
        show: false
      },
      data: [
        {
          xAxis: data.timeList.length - predictNum
        }
      ]
    }
  }];

  var option = {
    tooltip: {
      trigger: 'axis',
      backgroundColor: 'rgba(50,50,50,0.7)',
      borderColor: '#333',
      formatter: function (params) {
        let str = '' + params[0].name + '';
        let unit = '';
        for (let i = 0; i < params.length; i++) {
          let dataVal = 0;
          if (
            params[i].data &&
            params[i].data != undefined &&
            params[i].data != 'undefined'
          ) {
            dataVal = params[i].data.toFixed(2);
          }
          str +=
            "" +
            params[i].marker +
            params[i].seriesName +
            "" +
            dataVal +
            unit +
            '';
        }
        return str;
      },
      textStyle: {
        color: '#fff',
        align: 'left'
      }
    },
    legend: {
      show: true
    },
    grid: {
      top: '10%',
      left: '3%',
      right: '4%',
      bottom: '3%',
      containLabel: true
    },
    toolbox: {
      feature: {
        saveAsImage: {
          show: false
        }
      }
    },
    xAxis: {
      type: 'category',
      data: data.timeList,
      axisLine: {
        lineStyle: {
          color: '#c9c9c9'
        }
      },
      axisLabel: {
        color: '#232425',
        showMaxLabel: true,
        fontSize: 12,
        formatter: function (params) {
          let val = params;
          console.log(params.indexOf(' ' != -1))

          return val;
        }
      },
      splitArea: {
        show: true,
        areaStyle: {
          color: ['rgba(200,200,200,0.1)', 'transparent']
        }
      }
    },
    yAxis: {
      type: 'value',
      axisLine: {
        lineStyle: {
          color: '#232425'
        },
        show: false
      },
      axisTick: {
        show: false
      },
      splitLine: {
        lineStyle: {
          color: ['#ccc']
        }
      }
    },
    visualMap: {
      type: 'piecewise',
      show: false,
      dimension: 0,
      seriesIndex: 0,
      pieces: [
        {
          gt: 0,
          lt: data.timeList.length - predictNum,
          color: 'rgba(41,11,236,0.68)' //大于0小于12为蓝色
        },
        {
          gt: data.timeList.length - predictNum,
          color: 'rgba(229,27,88,0.68)' //大于12区间为红色
        }
      ]
    },
    series: series
  };
  myChart.setOption(option);
}


run();