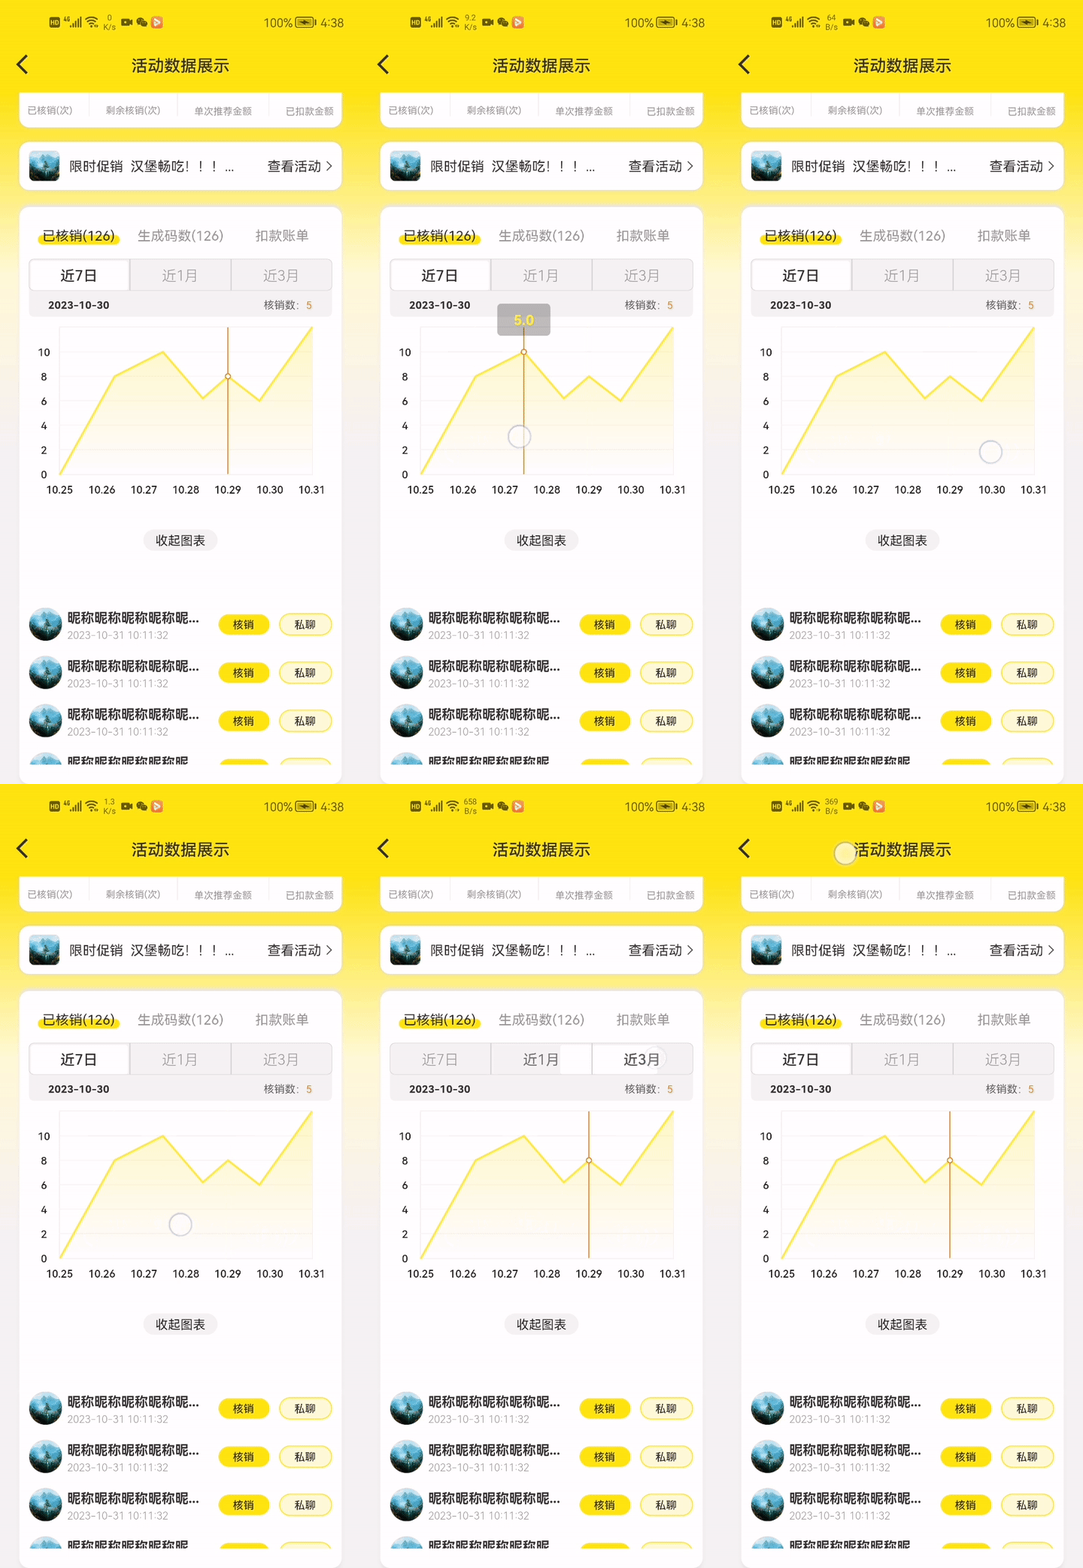
flutter仿支付宝余额宝年化收益折线图
绘制:
1.在pubspec.yaml中引入:fl_chart: 0.55.2
2.绘制:
import 'package:jade/utils/JadeColors.dart';
import 'package:util/easy_loading_util.dart';
import 'package:fl_chart/fl_chart.dart';
import 'package:flutter/material.dart';
import 'package:flutter_screenutil/flutter_screenutil.dart';
class MyLineChart extends StatefulWidget {
const MyLineChart({Key key}) : super(key: key);
State<MyLineChart> createState() => _MyLineChartState();
}
class _MyLineChartState extends State<MyLineChart> with TickerProviderStateMixin{
List<String> _tabs = ['近7日','近1月','近3月'];
TabController _tabController;
List<Color> gradientColors = [
Colors.yellow,
Colors.yellow,
];
//进入后默认显示指示竖线和轨迹球的点
FlSpot _defaultShowFlSpot = FlSpot(8, 4);
//进入页面时默认显示的点上的竖线显隐开关
bool _showSpotLine = true;
List<String> get weekDays => const ['10.21', '10.22', '10.23', '10.24', '10.25', '10.26', '10.27'];
void initState() {
// TODO: implement initState
super.initState();
_tabController = TabController(
length: _tabs.length,vsync: this);
}
void dispose() {
// TODO: implement dispose
_tabController.dispose();
super.dispose();
}
Widget build(BuildContext context) {
return Container(
child: Column(
children: <Widget>[
_tabBarView(),
_lineChartWidget()
],
),
);
}
//选项卡
_tabBarView(){
return Container(
width: double.infinity,
height: 120.w,
margin: EdgeInsets.only(bottom: 20.w),
decoration: BoxDecoration(
color: JadeColors.lightGrey,
borderRadius: BorderRadius.circular(5)
),
child: Column(
children: [
Container(
height: 70.w,
child: TabBar(
isScrollable: false,
labelPadding: EdgeInsets.symmetric(horizontal: 0),
indicator: BoxDecoration(
color: Colors.white,
borderRadius: BorderRadius.circular(5),
border: Border.all(width: 2,color: JadeColors.lightGrey)
),
labelColor: Color(0xff333333),
labelStyle: TextStyle(
fontSize: 30.sp,
fontWeight: FontWeight.w600,
),
unselectedLabelColor: JadeColors.grey,
unselectedLabelStyle: TextStyle(
fontSize: 30.sp,
fontWeight: FontWeight.w300
),
indicatorSize: TabBarIndicatorSize.tab,
controller: _tabController,
tabs: _tabs
.map((value) => Container(
width: double.infinity,
height: double.infinity,
padding: EdgeInsets.symmetric(horizontal: 20.w),
alignment: Alignment.center,
decoration: BoxDecoration(
borderRadius: BorderRadius.only(
topLeft: value == _tabs.first? Radius.circular(5): Radius.circular(0),
bottomLeft: value == _tabs.first? Radius.circular(5): Radius.circular(0),
topRight: value == _tabs.last? Radius.circular(5): Radius.circular(0),
bottomRight: value == _tabs.last? Radius.circular(5): Radius.circular(0),
),
border: Border.all(width: 1.w,color: JadeColors.grey_4)
),
child: Text(value))
).toList(),
onTap: (index) {
esLoadingToast('点击${_tabs[index]}');
},
)
),
Expanded(child: Container(
margin: EdgeInsets.only(left: 40.w,right: 40.w),
child: Row(
mainAxisAlignment: MainAxisAlignment.spaceBetween,
children: [
Text('2023-10-30',style: TextStyle(color: JadeColors.grey_2,fontSize: 22.sp,fontWeight: FontWeight.bold),),
Text.rich(TextSpan(
children: [
TextSpan(
text: '核销数:',
style: TextStyle(color: JadeColors.grey_3,fontSize: 22.sp)
),
TextSpan(
text: '5',
style: TextStyle(color: JadeColors.orange,fontSize: 22.sp)
)
]
))
],
),
))
],
),
);
}
//折线图表
_lineChartWidget(){
return AspectRatio(
aspectRatio: 1.70,
child: Padding(
padding: EdgeInsets.only(
right: 40.w,
),
child: LineChart(mainData())
),
);
}
LineChartData mainData() {
return LineChartData(
//网格
gridData: FlGridData(
show: true,
drawVerticalLine: false,
horizontalInterval: 1,
verticalInterval: 1,
getDrawingHorizontalLine: (value) {
return FlLine(
color: JadeColors.lightGrey,
strokeWidth: 1,
);
},
getDrawingVerticalLine: (value) {
return FlLine(
color: Colors.red,
strokeWidth: 1,
);
},
),
titlesData: FlTitlesData(
show: true,
rightTitles: AxisTitles(
sideTitles: SideTitles(showTitles: false),
),
topTitles: AxisTitles(
sideTitles: SideTitles(showTitles: false),
),
bottomTitles: AxisTitles(
sideTitles: SideTitles(
showTitles: true,
reservedSize: 30,
interval: 2,
getTitlesWidget: bottomTitleWidgets,
),
),
leftTitles: AxisTitles(
sideTitles: SideTitles(
showTitles: true,
interval: 1,
getTitlesWidget: leftTitleWidgets,
reservedSize: 30,
),
),
),
borderData: FlBorderData(
show: true,
// border: Border.symmetric(horizontal: BorderSide(color: JadeColors.lightGrey, width: 1)),
border: Border.fromBorderSide( BorderSide(color: JadeColors.lightGrey, width: 1)),
),
minX: 0,
maxX: 12,
minY: 0,
maxY: 6,
lineBarsData: [
LineChartBarData(
spots: const [
FlSpot(0, 0),
FlSpot(2.6, 4),
FlSpot(4.9, 5),
FlSpot(6.8, 3.1),
FlSpot(8, 4),
FlSpot(9.5, 3),
FlSpot(12, 6),
],
isCurved: false,
gradient: LinearGradient(
colors: gradientColors,
),
barWidth: 2,
dotData: FlDotData(
show: _showSpotLine,
getDotPainter: (spot, percent, barData, index) {
//当点是默认要显示的点时
if(spot == _defaultShowFlSpot){
return FlDotCirclePainter(
strokeWidth: 1,
strokeColor: const Color(0xffF27800),
radius: 2,
color: Colors.white,
);
}
return FlDotCirclePainter(
strokeWidth: 0,
strokeColor: Colors.yellow,
radius: 1,
color: Colors.yellow,
);
}
),
belowBarData: BarAreaData(
show: true,
gradient: LinearGradient(
colors: [Colors.yellow,Colors.white]
.map((color) => color.withOpacity(0.3))
.toList(),
begin: Alignment.topCenter, end: Alignment.bottomCenter
),
spotsLine: BarAreaSpotsLine(
show: _showSpotLine,
flLineStyle: FlLine(
color: const Color(0xffF27800),
strokeWidth: 1,
),
checkToShowSpotLine: (spot) {
if (spot == _defaultShowFlSpot) {
return true;
}
return false;
},
),
),
aboveBarData: BarAreaData(
show: _showSpotLine,
gradient: LinearGradient(
colors: [Colors.white,Colors.white]
.map((color) => color.withOpacity(0.3))
.toList(),
begin: Alignment.topCenter, end: Alignment.bottomCenter
),
spotsLine: BarAreaSpotsLine(
show: true,
flLineStyle: FlLine(
color: const Color(0xffF27800),
strokeWidth: 1,
),
checkToShowSpotLine: (spot) {
if (spot == _defaultShowFlSpot) {
return true;
}
return false;
},
),
),
),
],
lineTouchData: LineTouchData(
enabled: true,
getTouchLineEnd: (data, index) => double.infinity,
getTouchedSpotIndicator: (LineChartBarData barData, List<int> spotIndexes) {
return spotIndexes.map((spotIndex) {
return TouchedSpotIndicatorData(
//接触点竖线
FlLine(color: const Color(0xffF27800), strokeWidth: 1),
FlDotData(
//设置接触点 轨迹球画笔
getDotPainter: (spot, percent, barData, index) =>
FlDotCirclePainter(
strokeWidth: 1,
strokeColor: const Color(0xffF27800),
radius: 2,
color: Colors.white,
),
),
);
}).toList();
},
touchTooltipData: LineTouchTooltipData(
tooltipBgColor:Colors.black26
),
touchCallback: (FlTouchEvent event,LineTouchResponse response){
if(event!= null){
bool isInteractions = event.isInterestedForInteractions; //手指是否和图表交互(手指和图标交互时隐藏默认显示的点的指示线和轨迹球,手指离开时则隐藏)
setState(() {
_showSpotLine = !isInteractions;
});
}
if(response != null){
TouchLineBarSpot touchLineBarSpot = response?.lineBarSpots?.first;
int spotIndex = touchLineBarSpot?.spotIndex;
LineChartBarData lineChartBarData = touchLineBarSpot?.bar;
if(lineChartBarData != null && spotIndex != null){
FlSpot flSpot = lineChartBarData.spots[spotIndex];
// print('spotIndex= ${touchLineBarSpot?.spotIndex}'); //接触的是折线的第几个圆点
// print('barIndex= ${touchLineBarSpot?.barIndex}'); //接触的是第几条折线
// print('flSpot.x= ${flSpot?.x}');
print('flSpot.y= ${flSpot?.y}');
// print('spotIndex= ${touchLineBarSpot?.props}');
}
}
}
)
);
}
Widget bottomTitleWidgets(double value, TitleMeta meta) {
TextStyle style = TextStyle(
fontWeight: FontWeight.w600,
fontSize: 22.sp,
);
Widget text;
switch (value.toInt()) {
case 0:
text = Text('10.25', style: style);
break;
case 2:
text = Text(' 10.26 ', style: style);
break;
case 4:
text = Text(' 10.27 ', style: style);
break;
case 6:
text = Text(' 10.28 ', style: style);
break;
case 8:
text = Text(' 10.29 ', style: style);
break;
case 10:
text = Text(' 10.30 ', style: style);
break;
case 12:
text = Text(' 10.31 ', style: style);
break;
default:
text = Text('', style: style);
break;
}
return SideTitleWidget(
axisSide: meta.axisSide,
child: text,
);
}
Widget leftTitleWidgets(double value, TitleMeta meta) {
TextStyle style = TextStyle(
fontWeight: FontWeight.w600,
fontSize: 22.sp,
);
String text;
switch (value.toInt()) {
case 0:
text = '0';
break;
case 1:
text = '2';
break;
case 2:
text = '4';
break;
case 3:
text = '6';
break;
case 4:
text = '8';
break;
case 5:
text = '10';
break;
default:
return Container();
}
return Text(text, style: style, textAlign: TextAlign.center);
}
}
切换的选项卡没有绘制。对应的数据和坐标点之间的换算没做,要根据后台给的数据操作,现在这个只是单纯的绘制。
