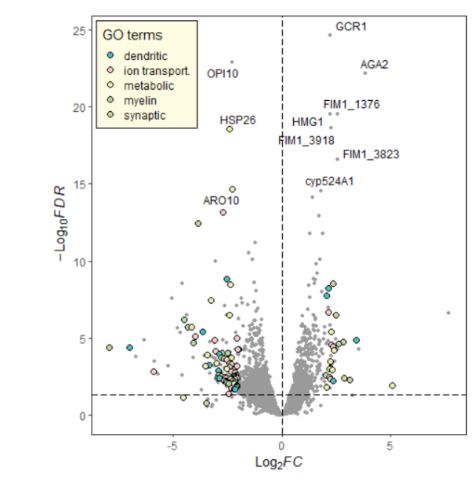
R语言绘制精美图形 | 火山图 | 学习笔记
一边学习,一边总结,一边分享!
教程图形
前言
最近的事情较多,教程更新实在是跟不上,主要原因是自己没有太多时间来学习和整理相关的内容。一般在下半年基本都是非常忙,所有一个人的精力和时间有限,只能顾一方面。所以,长时间不更新是很正常的,若在看本教程的你,若有愿意分享的教程,可以投稿,我们也欢迎投稿。
今天,来分享一下近两天自己的学习笔记。火山图,此图也是实用性很强,80%的同学应该可以用得到,今天分享的只是学习笔记的一部分,后面会逐渐完善。既然是学习笔记,那么我们也有参考的教程,我们也会再文末附上参考的教程,大家也可以直接到对应教程中学习。
原文访问链接:
https://mp.weixin.qq.com/s/mQ9TaQu3b3waNHtu8gfQtw
设置路劲
setwd("E:\\小杜的生信筆記\\2023\\20231117-火山图")
rm(list = ls())
加载相关包
library(ggplot2)
library(RColorBrewer)
library(ggrepel)
library(RUnit)
library(ggforce)
library(tidyverse)
library(ggpubr)
library(ggprism)
library(paletteer)
1、加载及处理数据
加载数据
df <- read.csv("all.limmaOut.csv",header = T,row.names = 1)
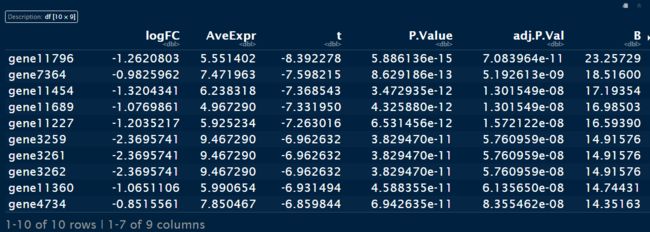
head(df)
1.2 数据分类
使用runif对添加数据logCMP,用于后续的分析
df$logCMP <- stats::runif(12035, 0, 16)
对数据进行Up和Down分类
分类标准:
- P值小于0.05
- |logFC| >= 1
筛选标准可以进行自己的需求进行设置
##'@判断基因up or down

df$Group <- factor(ifelse(df$P.Value < 0.05 & abs(df$logFC) >= 1,
                          ifelse(df$logFC >= 1, 'Up','Down'),'NotSignifi'))
df[1:10,1:8]

table(df$Group)
df$gene <- row.names(df)
1.3 设置主题
可根据自己需求进行设置,或是统一在这里设置即可。
##'@主题
mytheme <- theme(panel.background = element_rect(fill = NA),
                 plot.margin = margin(t=10,r=10,b=5,l=5,unit = "mm"),
                 # axis.ticks.y = element_blank(),
                 axis.ticks.x = element_line(colour = "grey40",size = 0.5),
                 axis.line = element_line(colour = "grey40",size = 0.5),
                 axis.text.x = element_text(size = 10),
                 axis.title.x = element_text(size = 12),
                 panel.grid.major.y = element_line(colour = NA,size = 0.5),
                 panel.grid.major.x = element_blank())
2 绘制基础差异基因火山图
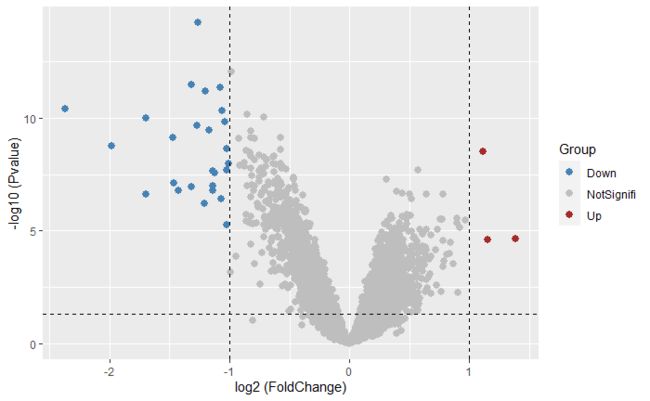
2.1 绘制基础图形
####'@绘制基础图形
ggplot(df, aes(x = logFC, y = -log10(P.Value), colour = Group))+
  geom_point(size =4, shape = 20, stroke = 0.5)+
  #控制最人气泡和最小气泡,调节气泡相对大小
  scale_size(limits = c(2,16))+
  ##设置颜色
  #scale_fill_manual(values = c("#fe0000","#13fc00","#bdbdbd"))+
  scale_color_manual(values=c('steelblue','gray','brown'))+
  ylab('-log10 (Pvalue)')+
  xlab('log2 (FoldChange)')+
  ## 增加横竖线条
  geom_vline(xintercept = c(-1,1),lty = 2, col = "black", lwd = 0.5)+
  geom_hline(yintercept = -log10(0.05), lty = 2, col = "black", lwd = 0.5)
难点代码解读
1.增加横竖线条
geom_vline()添加垂直辅助线,xintercept表示辅助线的位置,lty表示线的类型(虚-实),col表示线的颜色,lwd表示线的粗细
geom_hline()添加水平辅助线,yintercept表示辅助线的位置,lty表示线的类型(虚-实),col表示线的颜色,lwd表示线的粗细
2.2 设置火山图散点的大小
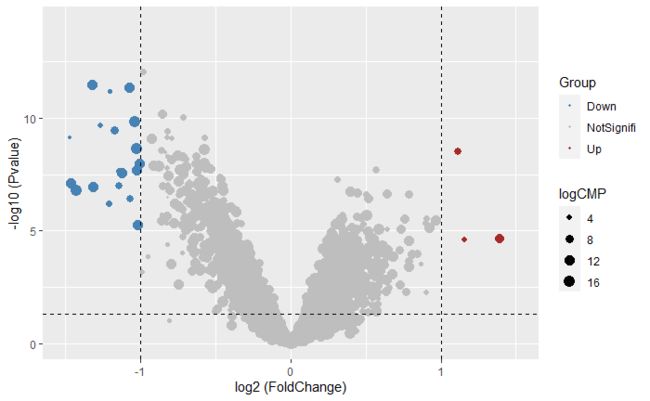
在上面的图形中,火山图中所有的使用size = logCMP进行修改
ggplot(df, aes(x = logFC, y = -log10(P.Value), size = logCMP,colour = Group))+
  geom_point(shape = 20, stroke = 0.5)+
  #控制最人气泡和最小气泡,调节气泡相对大小
  scale_size(limits = c(2,16))+
  ##设置颜色
  #scale_fill_manual(values = c("#fe0000","#13fc00","#bdbdbd"))+
  scale_color_manual(values=c('steelblue','gray','brown'))+
  ylab('-log10 (Pvalue)')+
  xlab('log2 (FoldChange)')+
  ## 增加横竖线条
  geom_vline(xintercept = c(-1,1),lty = 2, col = "black", lwd = 0.5)+
  geom_hline(yintercept = -log10(0.05), lty = 2, col = "black", lwd = 0.5)
2.2 调整火山图的X轴坐标
调整X轴的取值范围
有时候,我们在绘制火山图时,会出现X或Y轴坐标较大的现象,对火山图整体美观性较差,那么适当限制基因调整图形美观.
###'@查看差异基因最大值是多少
###'@此步根据自己的火山图进行设置是否有需要设置
max(abs(df$logFC))
使用xlim()函数进行修改
ggplot(df, aes(x = logFC, y = -log10(P.Value), size = logCMP,colour = Group))+
  geom_point(shape = 20, stroke = 0.5)+
  #控制最人气泡和最小气泡,调节气泡相对大小
  scale_size(limits = c(2,16))+
  ##设置颜色
  #scale_fill_manual(values = c("#fe0000","#13fc00","#bdbdbd"))+
  scale_color_manual(values=c('steelblue','gray','brown'))+
  ylab('-log10 (Pvalue)')+
  xlab('log2 (FoldChange)')+
  ## 增加横竖线条
  geom_vline(xintercept = c(-1,1),lty = 2, col = "black", lwd = 0.5)+
  geom_hline(yintercept = -log10(0.05), lty = 2, col = "black", lwd = 0.5)+
  ##设置X轴的取值范围
  xlim(c(-1.5,1.5))
2.3 修改图中图例
使用ggplot()绘图最方便就是修改图形或调整图形很方便,但是很多时间都需要我们自己不断的练习,加深自己印象。
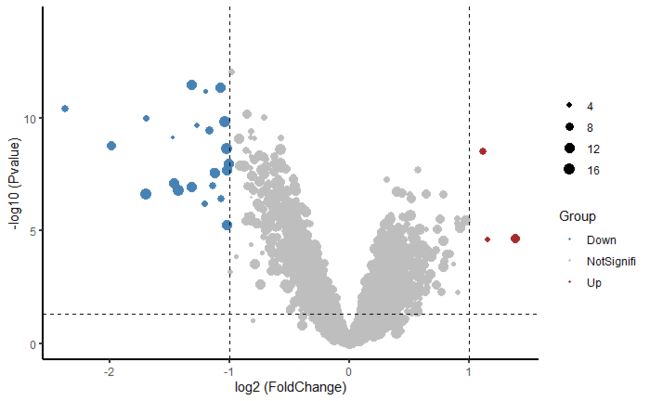
使用label()修改图中标题和图例
ggplot(df, aes(x = logFC, y = -log10(P.Value), size = logCMP,colour = Group))+
  geom_point( shape = 20, stroke = 0.5)+
  #控制最人气泡和最小气泡,调节气泡相对大小
  scale_size(limits = c(2,16))+
  ##设置颜色
  #scale_fill_manual(values = c("#fe0000","#13fc00","#bdbdbd"))+
  scale_color_manual(values=c('steelblue','gray','brown'))+
  # ylab('-log10 (Pvalue)')+
  # xlab('log2 (FoldChange)')+
    labs(x = 'log2 (FoldChange)',
         y = '-log10 (Pvalue)',
         ## 图例
         fill = "",
         size = "")+
# ## 增加横竖线条
  geom_vline(xintercept = c(-1,1),lty = 2, col = "black", lwd = 0.5)+
  geom_hline(yintercept = -log10(0.05), lty = 2, col = "black", lwd = 0.5)+
  ## 设置主题
  theme_classic(
    base_line_size = 0.8  ## 设置坐标轴的粗细
  )+
  ## 设置图例大小
  guides(fill = guide_legend(override.aes = list(size = 8)))
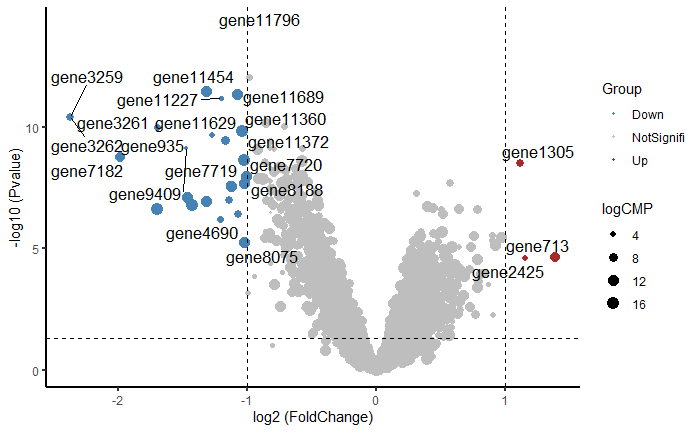
2.4 添加基因名
使用一下命令添加标记基因名字
#'@添加关注的点的基因名
  geom_text_repel(
    data = df[df$P.Value < 0.05 & abs(df$logFC) > 1,],
    aes(label = gene),
    size = 4.5,
    color = "black",
    segment.color = "black", show.legend = FALSE)
ggplot(df, aes(x = logFC, y = -log10(P.Value), size = logCMP,colour = Group))+
  geom_point( shape = 20, stroke = 0.5)+
  #控制最人气泡和最小气泡,调节气泡相对大小
  scale_size(limits = c(2,16))+
  ##设置颜色
  #scale_fill_manual(values = c("#fe0000","#13fc00","#bdbdbd"))+
  scale_color_manual(values=c('steelblue','gray','brown'))+
  ylab('-log10 (Pvalue)')+
  xlab('log2 (FoldChange)')+
#'@添加关注的点的基因名
  geom_text_repel(
    data = df[df$P.Value < 0.05 & abs(df$logFC) > 1,],
    aes(label = gene),
    size = 4.5,
    color = "black",
    segment.color = "black", show.legend = FALSE)+
  # ## 增加横竖线条
  geom_vline(xintercept = c(-1,1),lty = 2, col = "black", lwd = 0.5)+
  geom_hline(yintercept = -log10(0.05), lty = 2, col = "black", lwd = 0.5)+
  ## 设置主题
  theme_classic(
    base_line_size = 0.8  ## 设置坐标轴的粗细
  )+
  ## 设置图例大小
  guides(fill = guide_legend(override.aes = list(size = 8)))
2.5 图形美化
ggplot(df, aes(x = logFC, y = -log10(P.Value), size = logCMP,colour = Group))+
  geom_point( shape = 20, stroke = 0.5)+
  #控制最人气泡和最小气泡,调节气泡相对大小
  scale_size(limits = c(2,16))+
  ##设置颜色
  #scale_fill_manual(values = c("#fe0000","#13fc00","#bdbdbd"))+
  scale_color_manual(values=c('steelblue','gray','brown'))+
  ylab('-log10 (Pvalue)')+
  xlab('log2 (FoldChange)')+
#'@添加关注的点的基因名
  geom_text_repel(
    data = df[df$P.Value < 0.05 & abs(df$logFC) > 1,],
    aes(label = gene),
    size = 3.5,
    color = "black",
    segment.color = "black", show.legend = FALSE)+
  # ## 增加横竖线条
  geom_vline(xintercept = c(-1,1),lty = 2, col = "black", lwd = 0.5)+
  geom_hline(yintercept = -log10(0.05), lty = 2, col = "black", lwd = 0.5)+
  ## 设置主题
  theme_classic(
    base_line_size = 0.8  ## 设置坐标轴的粗细
  )+
  ## 设置图例大小
  guides(fill = guide_legend(override.aes = list(size = 5)))+
  mytheme
  ##设置主题
  # theme(axis.title.x = element_text(color = "black",
  #                                   size = 10,
  #                                   face = "bold"),
  #       axis.title.y = element_text(color = "black",
  #                                   size = 10),
  #       ##'@设置图例
  #       legend.text = element_text(color = "red",
  #                                  size = 8,
  #                                  face = "bold"))
解读
  theme(axis.title.x = element_text(color = "black",
                                    size = 10,
                                    face = "bold"),
        axis.title.y = element_text(color = "black",
                                    size = 10),
        ##'@设置图例
        legend.text = element_text(color = "red",
                                   size = 8,
                                   face = "bold"))
- X轴、Y轴字体调整
axis.title.x/axis.title.y
color、size、bold表示;颜色、大小、加粗 - 图例
legend.text
3 渐变火山图绘制
该教程在前面的文章中已经发出,感兴趣的可以自己查看。教程链接差异表达基因火山图绘制
3.1 数据处理
head(df)
把各列数据整理成画图所需的格式
### Score列、或是DESep输出数据
fc <- df$AveExpr
head(fc)
names(fc) <- rownames(dat)  ## 匹配数据

### -log10P列
 p <- dat$`-log10P`
names(p) <- names(dat)
3.2 自定义颜色
mycol <- c("#B2DF8A","#FB9A99","#33A02C","#E31A1C","#B15928","#6A3D9A","#CAB2D6","#A6CEE3","#1F78B4","#FDBF6F","#999999","#FF7F00")
cols.names <- unique(df$Group)
cols.code <- mycol[1:length(cols.names)]
names(cols.code) <- cols.names
col <- paste(cols.code[as.character(df$Group)],"BB", sep="")
i <-  df$Group %in% c("Up","Not","Down")

###'@-log10P列
p <- -log10(df$P.Value)
names(p) <- names(df)

###'@size列
size = df$logCMP
names(size) <- rownames(df)

###'@pval列
pp <- df$P.Value
names(pp) <- rownames(df)
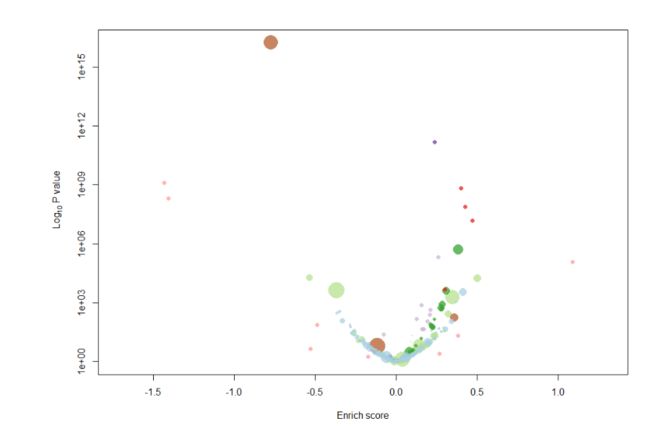
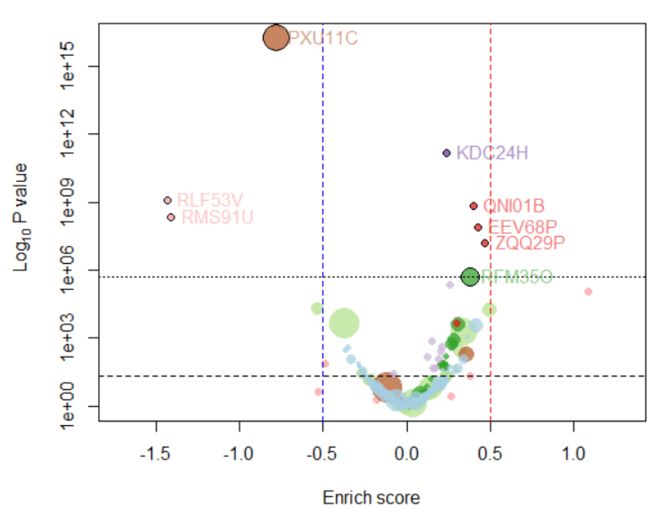
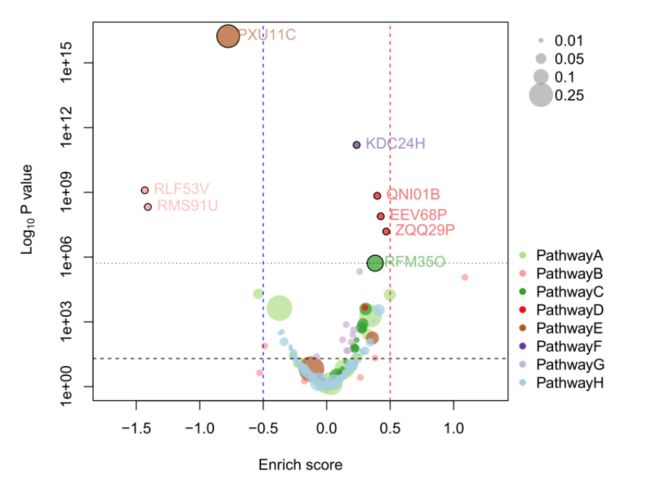
3.3 绘图
plot(df, p, log = 'y',
      col = paste(cols.code[as.character(df$logCMP)], "BB", sep = ""),
     pch = 16,
     # ylab = bquote(~Log[10]~"P value"),
     # xlab = "Enrich score",
     # 用小泡泡画不感兴趣的pathway
     cex = ifelse(i, size,1)
     )
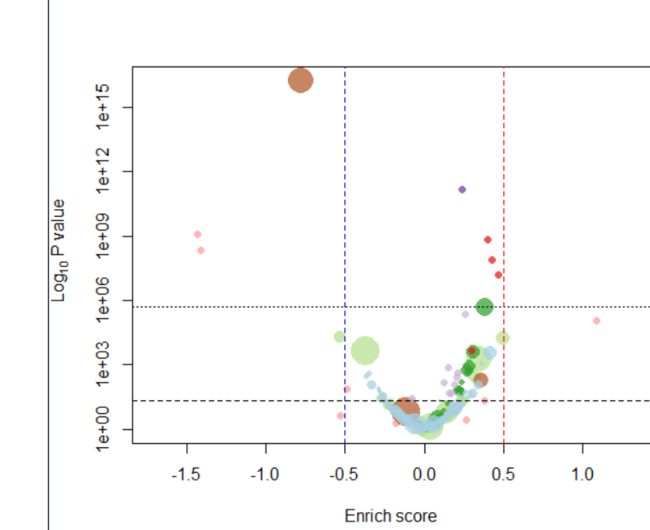
# 添加横线
abline(h=1/0.05, lty=2, lwd=1)
abline(h=1/max(pp[which(p.adjust(pp, "bonf") < 0.001)]), lty=3, lwd=1) #标黑圈和文字的阈值

# 添加竖线
abline(v=-0.5, col="blue", lty=2, lwd=1)
abline(v=0.5, col="red", lty=2, lwd=1
w <- which(p.adjust(pp,"bonf") < 0.001) #bonferroni correction
points(fc[w], p[w], pch=1, cex=ifelse(i[w], dat[w,"size"],1))
## Add an alpha value to a colour
add.alpha <- function(col, alpha=1){
  if(missing(col))
    stop("Please provide a vector of colours.")
  apply(sapply(col, col2rgb)/255, 2,
        function(x)
          rgb(x[1], x[2], x[3], alpha=alpha))
}
## 标记最显著的基因
cols.alpha <- add.alpha(cols.code[dat[w,]$group], alpha=0.6)
text(fc[w], p[w], names(fc[w]),
     pos=4, #1, 2, 3 and 4, respectively indicate positions below, to the left of, above and to the right of the specified coordinates.
     col=cols.alpha)
# 添加size的图例
par(xpd = TRUE) #all plotting is clipped to the figure region
f <- c(0.01,0.05,0.1,0.25)
s <- sqrt(f*50)
legend("topright",
       inset=c(-0.2,0), #把图例画到图外
       legend=f, pch=16, pt.cex=s, bty='n', col=paste("#88888888"))

# 添加pathway颜色的图例
legend("bottomright",
       inset=c(-0.25,0), #把图例画到图外
       pch=16, col=cols.code, legend=cols.names, bty="n")
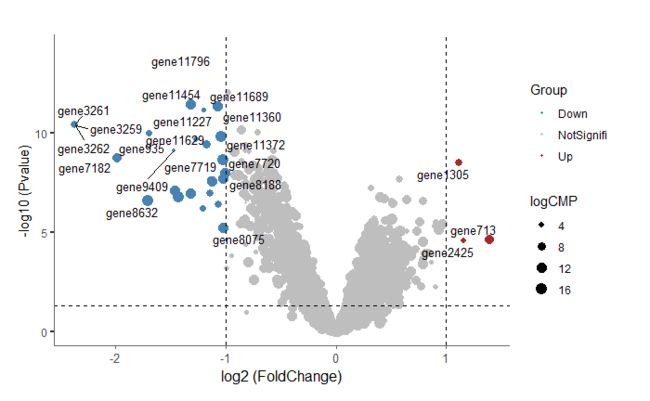
4. 筛选Top5的差异基因进行标记
4.1 筛选的down和up前5个(或N个)基因进行标记
##down
down <- filter(df, Group == "Down") %>%
  distinct(gene, .keep_all = T) %>%
  top_n(5, -log10(P.Value))

##up top 5
up <- filter(df, Group == "Up") %>%
  distinct(gene, .keep_all = T) %>%
  top_n(5, -log10(P.Value))
4.2绘图
ggplot(df, aes(x = logFC, y = -log10(P.Value), size = logCMP,colour = Group))+
  geom_point( shape = 20, stroke = 0.5)+
  #控制最人气泡和最小气泡,调节气泡相对大小
  scale_size(limits = c(2,16))+
  ##设置颜色
  #scale_fill_manual(values = c("#fe0000","#13fc00","#bdbdbd"))+
  scale_color_manual(values=c('steelblue','gray','brown'))+
  #scale_colour_manual(name = "", values = alpha(c("#EB4232","#d8d8d8","#2DB2EB"), 0.7)) +
  ##'@X轴和Y轴限制
  # scale_x_continuous(limits = c(-12, 12),breaks = seq(-12, 12, by = 4)) +
  # scale_y_continuous(expand = expansion(add = c(0, 0)),limits = c(0, 180),breaks = seq(0, 180, by = 20)) +
  ylab('-log10 (Pvalue)')+
  xlab('log2 (FoldChange)')+
#'@添加关注的点的基因名
#'@添加down top gene
  geom_text_repel(
    data = up,aes(x = logFC, y = -log10(P.Value), label = gene),
                      seed = 123,color = 'black',show.legend = FALSE,
                      min.segment.length = 0,#始终为标签添加指引线段;若不想添加线段,则改为Inf
                      segment.linetype = 1, #线段类型,1为实线,2-6为不同类型虚线
                      force = 2,#重叠标签间的排斥力
                      force_pull = 2,#标签和数据点间的吸引力
                      size = 4,
                      box.padding = unit(2, "lines"),
                      point.padding = unit(1, "lines"),#点到线的距离
                      max.overlaps = Inf)+
  ##'@添加up top gene
  geom_text_repel(
    data = down,aes(x = logFC, y = -log10(P.Value), label = gene),
                      seed = 123,
    color = 'black',show.legend = FALSE,
                      min.segment.length = 0,#始终为标签添加指引线段;若不想添加线段,则改为Inf
                      segment.linetype = 1, #线段类型,1为实线,2-6为不同类型虚线
                      force = 6,#重叠标签间的排斥力
                      force_pull = 1,#标签和数据点间的吸引力
                      size = 4,
                      box.padding = unit(2, "lines"),
                      point.padding = unit(1, "lines"),#点到线的距离
                      max.overlaps = Inf)+
  # ## 增加横竖线条
  geom_vline(xintercept = c(-1,1),lty = 2, col = "black", lwd = 0.5)+
  geom_hline(yintercept = -log10(0.05), lty = 2, col = "black", lwd = 0.5)+
  ## 设置主题
  theme_classic(
    base_line_size = 0.8  ## 设置坐标轴的粗细
  )+
  ## 设置图例大小
  guides(fill = guide_legend(override.aes = list(size = 5)))+
  mytheme
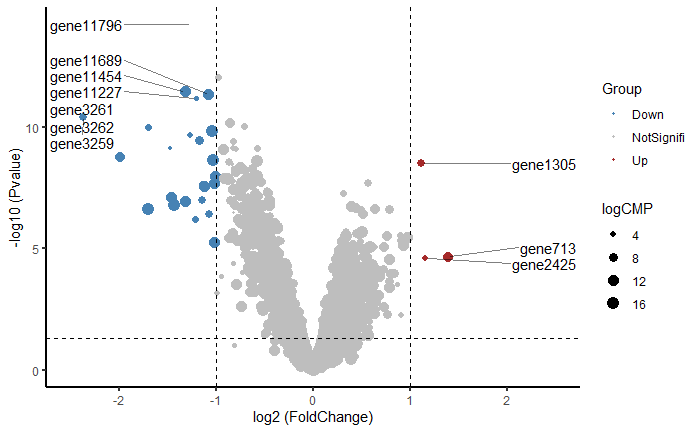
4.3 对齐标签
需要重新进行调整坐标信息,此坐标位置,可以根据自己需求进行调整
nudge_x_up = 2.5 - up$logFC
nudge_x_down = -2.5 - down$logFC
通过添加nudge_x信息即可实现此功能
ggplot(df, aes(x = logFC, y = -log10(P.Value), size = logCMP,colour = Group))+
  geom_point( shape = 20, stroke = 0.5)+
  #控制最人气泡和最小气泡,调节气泡相对大小
  scale_size(limits = c(2,16))+
  ##设置颜色
  #scale_fill_manual(values = c("#fe0000","#13fc00","#bdbdbd"))+
  scale_color_manual(values=c('steelblue','gray','brown'))+
  #scale_colour_manual(name = "", values = alpha(c("#EB4232","#d8d8d8","#2DB2EB"), 0.7)) +
  ##'@X轴和Y轴限制
  # scale_x_continuous(limits = c(-12, 12),breaks = seq(-12, 12, by = 4)) +
  # scale_y_continuous(expand = expansion(add = c(0, 0)),limits = c(0, 180),breaks = seq(0, 180, by = 20)) +
  ylab('-log10 (Pvalue)')+
  xlab('log2 (FoldChange)')+
#'@添加关注的点的基因名
#'@添加down top gene
  geom_text_repel(
    data = up,aes(x = logFC, y = -log10(P.Value), label = gene),
                      seed = 123,color = 'black',show.legend = FALSE,
                      min.segment.length = 0,#始终为标签添加指引线段;若不想添加线段,则改为Inf
                      segment.linetype = 1, #线段类型,1为实线,2-6为不同类型虚线
                      segment.color = 'black', #线段颜色
                      segment.alpha = 0.5, #线段不透明度
                      nudge_x = nudge_x_up, #标签x轴起始位置调整
                      direction = "y", #按y轴调整标签位置方向,若想水平对齐则为x
                      hjust = 0, #对齐标签:0右对齐,1左对齐,0.5居中
                      force = 2,#重叠标签间的排斥力
                      force_pull = 2,#标签和数据点间的吸引力
                      size = 4,
                      box.padding = unit(0.1, "lines"),
                      point.padding = unit(0.1, "lines"),
                      max.overlaps = Inf)+
  ##'@添加up top gene
  geom_text_repel(
    data = down,aes(x = logFC, y = -log10(P.Value), label = gene),
                      seed = 123,color = 'black',show.legend = FALSE,
                      min.segment.length = 0,#始终为标签添加指引线段;若不想添加线段,则改为Inf
                      segment.linetype = 1, #线段类型,1为实线,2-6为不同类型虚线
                      segment.color = 'black', #线段颜色
                      segment.alpha = 0.5, #线段不透明度
                      nudge_x = nudge_x_down, #标签x轴起始位置调整
                      direction = "y", #按y轴调整标签位置方向,若想水平对齐则为x
                      hjust = 1, #对齐标签:0右对齐,1左对齐,0.5居中
                      force = 2,#重叠标签间的排斥力
                      force_pull = 2,#标签和数据点间的吸引力
                      size = 4,
                      box.padding = unit(0.1, "lines"),
                      point.padding = unit(0.1, "lines"),
                      max.overlaps = Inf)+
  # ## 增加横竖线条
  geom_vline(xintercept = c(-1,1),lty = 2, col = "black", lwd = 0.5)+
  geom_hline(yintercept = -log10(0.05), lty = 2, col = "black", lwd = 0.5)+
  ## 设置主题
  theme_classic(
    base_line_size = 0.8  ## 设置坐标轴的粗细
  )+
  ## 设置图例大小
  guides(fill = guide_legend(override.aes = list(size = 5)))
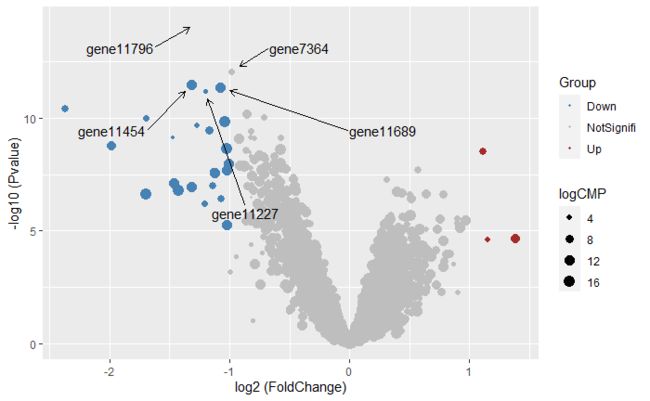
4.4 添加箭头
top5 <- filter(df, Group != "Stable") %>% distinct(gene, .keep_all = T) %>% top_n(5, -log10(P.Value))
ggplot(df, aes(x = logFC, y = -log10(P.Value), size = logCMP,colour = Group))+
  geom_point( shape = 20, stroke = 0.5)+
  #控制最人气泡和最小气泡,调节气泡相对大小
  scale_size(limits = c(2,16))+
  ##设置颜色
  #scale_fill_manual(values = c("#fe0000","#13fc00","#bdbdbd"))+
  scale_color_manual(values=c('steelblue','gray','brown'))+
  #scale_colour_manual(name = "", values = alpha(c("#EB4232","#d8d8d8","#2DB2EB"), 0.7)) +
  ##'@X轴和Y轴限制
  # scale_x_continuous(limits = c(-12, 12),breaks = seq(-12, 12, by = 4)) +
  # scale_y_continuous(expand = expansion(add = c(0, 0)),limits = c(0, 180),breaks = seq(0, 180, by = 20)) +
  ylab('-log10 (Pvalue)')+
  xlab('log2 (FoldChange)')+
  ##'@添加箭头
  geom_text_repel(data = top5,aes(x = logFC, y = -log10(P.Value), label = gene),
                      seed = 2345,color = 'black',show.legend = FALSE,
                      min.segment.length = 1,#始终为标签添加指引线段;若不想添加线段,则改为Inf
                      arrow = arrow(length = unit(0.02, "npc"),type = "open", ends = "last"),
                      force = 10,force_pull = 1,
                      size = 4,
                      box.padding = 2,point.padding = 1,
                      max.overlaps = Inf)
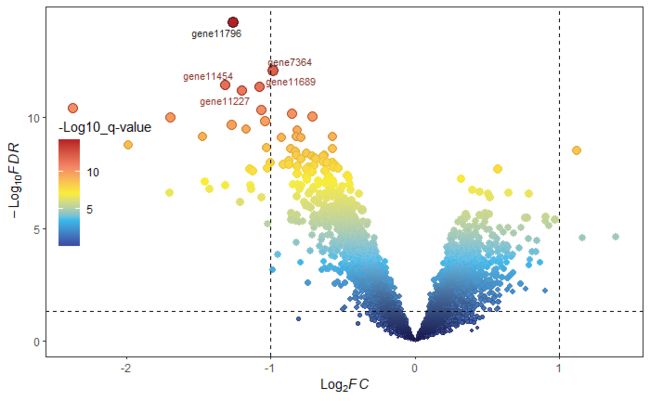
5 渐变火山图
5.1 加载所需的包
#devtools::install_github("BioSenior/ggvolcano")
library(ggVolcano)
library(RColorBrewer)
5.2 绘图
df[1:10,1:9]
gradual_volcano(df, x = "logFC", y = "P.Value",
                      label = "gene",
                label_number = 5, ## 显示top5的基因名
                output = FALSE)
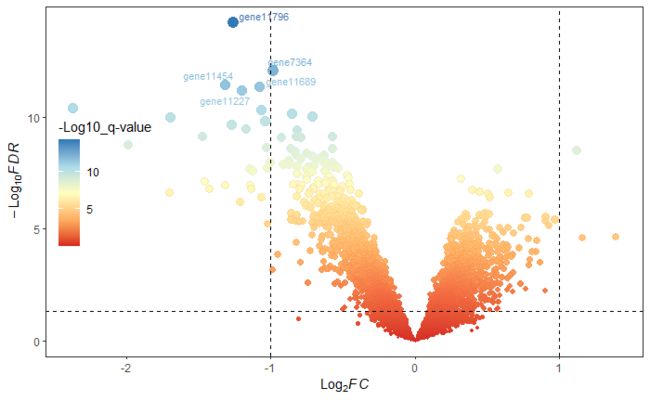
gradual_volcano(df, x = "logFC", y = "P.Value",
                label = "gene",
                fills = brewer.pal(5, "RdYlBu"),
                colors = brewer.pal(8, "RdYlBu"),
                label_number = 5, ## 显示top5的基因名
                output = FALSE)
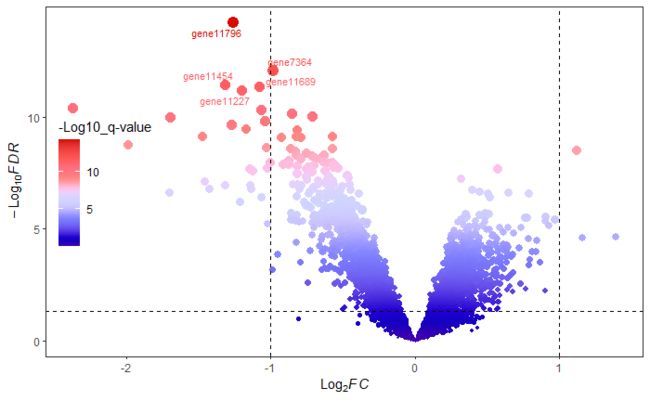
gradual_volcano(df, x = "logFC", y = "P.Value",
                label = "gene",
                label_number = 5, ## 显示top5的基因名
                output = FALSE)+
  ggsci::scale_color_gsea()+
  ggsci::scale_fill_gsea()
5.3 GO通路火山图
或你有相关GO注释文件,你可以提供给相关的数据,进行绘制。
在这里,我们不在演示,若你需要,可以根据原文的方法进行绘制图形。
ata("term_data")
#  Gene.names   term
#1       TDP1 myelin
#2    YDR387C myelin
#3      MAM33 myelin
#4       BAR1 myelin
#5       IQG1 myelin
#6       AIM3 myelin

p1 <- term_volcano(deg_data, term_data,
                   x = "log2FoldChange", y = "padj",
                   label = "row", label_number = 10, output = FALSE)
#修改散点颜色和描边
library(RColorBrewer)
deg_point_fill <- brewer.pal(5, "RdYlBu")
names(deg_point_fill) <- unique(term_data$term)
p2 <- term_volcano(data, term_data,
                   x = "log2FoldChange", y = "padj",
                   normal_point_color = "#75aadb",
                   deg_point_fill = deg_point_fill,
                   deg_point_color = "grey",
                   legend_background_fill = "#deeffc",
                   label = "row", label_number = 10, output = FALSE)
本教程参考链接:<学习者可以直接访问原文链接>
- https://mp.weixin.qq.com/s/wkUxY_zzYnCDwAPD0btHow
- https://mp.weixin.qq.com/s/R6yb-sFKRkzGuACs61TbsQ
- https://mp.weixin.qq.com/s/TWI-Tt741Gqe9ERzZr23yg
- https://mp.weixin.qq.com/s/yVahDcmuUU7cPikTt4ahNg
往期文章:
1. 复现SCI文章系列专栏
2. 《生信知识库订阅须知》,同步更新,易于搜索与管理。
3. 最全WGCNA教程(替换数据即可出全部结果与图形)
-
WGCNA分析 | 全流程分析代码 | 代码一
-
WGCNA分析 | 全流程分析代码 | 代码二
-
WGCNA分析 | 全流程代码分享 | 代码三
-
WGCNA分析 | 全流程分析代码 | 代码四
-
WGCNA分析 | 全流程分析代码 | 代码五(最新版本)
4. 精美图形绘制教程
- 精美图形绘制教程
5. 转录组分析教程
转录组上游分析教程[零基础]
小杜的生信筆記 ,主要发表或收录生物信息学的教程,以及基于R的分析和可视化(包括数据分析,图形绘制等);分享感兴趣的文献和学习资料!!
