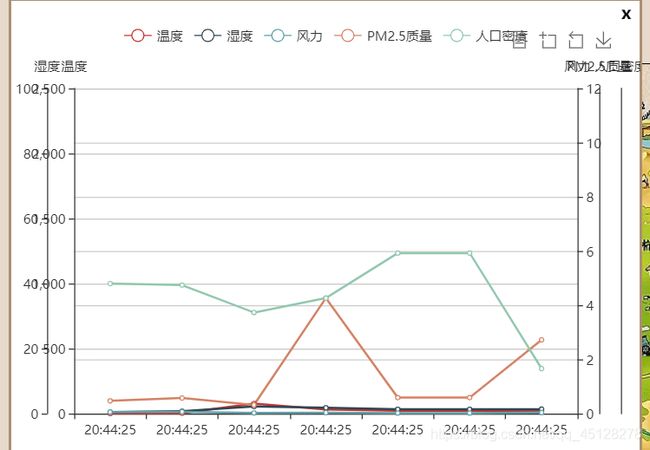
echarts多条y轴重叠/数据量过大/y轴无刻度/增加x轴滚动条
多条y轴不重叠
yAxis: [
                    {
                        name:'温度',
                        position: "left",
                        type: 'value',
                        min:0,
                        boundaryGap: [0, '100%'],

                    },{
                        name:'湿度',
                        position:'left',
                        type: 'value',
                        min:0,
                        max:100,
                        boundaryGap: [10, 10],
                        offset:30,
                    },{
                        name:'风力',
                        position:'right',
                        type: 'value',
                        min:0,
                        max:12,
                    },{
                        name:'PM2.5质量',
                        position:'right',
                        type: 'value',
                        offset:20,
                    },{
                        name:'人口密度',
                        position:'right',
                        type: 'value',
                        splitNumber: 10, // Y 轴分隔格数
                        splitLine: {
                            // Y 轴分隔线样式
                            show: true,
                            lineStyle: {
                                color: ["#f3f0f0"],
                                width: 2,
                                type: "solid"
                            }
                        },offset:40,

                    },
                ],
y轴不显示刻度,serial的name和y轴name对应了无效果
错误:
数据没有跟刻度值对应起来,而且右边两个轴没有自适应显示出数值
解决办法:
在serial里加入yAxisIndex属性。
series: [{name: '温度', data: data.data1, type: 'line',yAxisIndex:0,},{name: '湿度', data: data.data2, type: 'line',yAxisIndex:1,},{name: '风力', yAxisIndex:2,data: data.data3, type: 'line'} ,{name: 'PM2.5质量', data: data.data4, type: 'line',yAxisIndex:3,},{name: '人口密度', data: data.data5, type: 'line',yAxisIndex:4,}]
除了初始的y轴,其他的顺序为从左到右数。
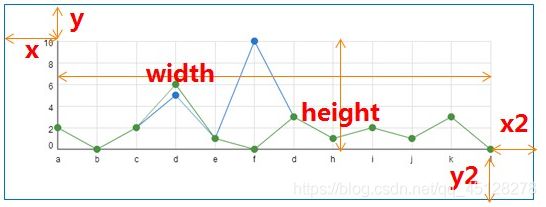
canvas过宽/右边重叠y轴显示不全
,grid:{
                    x2:85,
                    x:55,
                }
X轴数据太多增加滚动条
dataZoom: [{
                    type: 'slider',
                    show: true,
                    xAxisIndex: [0],
                    bottom: -5,
                    start: 10,
                    height:14,
                    end: 90 //初始化滚动条
                }],
调节bottom值,调整其上下位置。


