基于Python实现大型家用电器和电子产品在线商店购买数据分析【500010098】
导入模块
import pandas as pd
import numpy as np
import matplotlib.pyplot as plt
获取数据
df= pd.read_csv( r"./data/kz.csv",sep=',')
数据描述
该数据包含2020年4月至2020年11月从大型家用电器和电子产品在线商店购买的数据。
数据说明
- event_time:行为类别
- event_type:行为类别
- product_id :产品编号
- category_id :产品的类别ID
- category_code:产品的类别分类法(代码名称)
- brand:品牌名称
- price:产品价格
- user_id:用户ID
数据信息
df.shape
![]()
df.info()
df.head()
数据处理
# 对比每一列数据大小,判断有无缺失值
df.isnull().any()
# 因为数据较大,删除掉缺失数据
df=df.dropna()
# 判断有无重复值
df.duplicated()
# 删除重复值
df=df.drop_duplicates()
df.shape
![]()
df.describe()
# 修改时间列数据类型 预计时间:5~6分钟
df['event_time']=df['event_time'].apply(pd.to_datetime)
df['month'] = df.event_time.values.astype('datetime64[M]')

df.info()
数据处理
进行用户消费趋势分析(按月)
df_month=df.groupby(['month'])
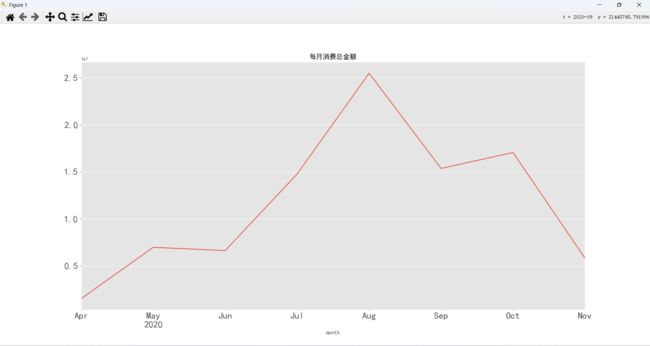
每月的消费总金额
- 消费金额在4到8月总体呈上升形态
- 8月单月消费总额最高,超过2500万元
- 自8月以后消费出现明显下滑趋势
每月的消费人数

用户数量变化趋势同消费总额变化趋势较为一致

上下两图对比可知,在4到8月两图总体呈上升变化,均在8月份达到最高值,而后开始显现下滑趋势。
特别关注点在7月份,两图中,7月皆为拐点位置。图一中7月后增势更加明显,图二中7月后消费人数增长减缓。两者结合可知,7月用户购买单价有所提高。
进行品牌消费情况分析
各品牌产品消费总金额
各品牌用户数量

在用户数量上,三星一枝独秀,遥遥领先于其他品牌。接近为苹果用户数的三倍,而两者销售额约6%,可见苹果人均用户消费远大于三星用户人均消费。 另外上述两幅图数据变化趋势,明显也满足二八原则。
用户个体消费分析
用户消费金额、消费次数的描述性统计
df_=df.copy()
df_.index=df_['event_time']

df_user=df_["2020-04":"2020-11"].groupby('user_id')
df_user.sum().describe()
df_user.count().describe()

用户平均消费1117元,50%用户消费447元,差距较大。说明大部分用户消费较低,小部分用户发生了高消费。
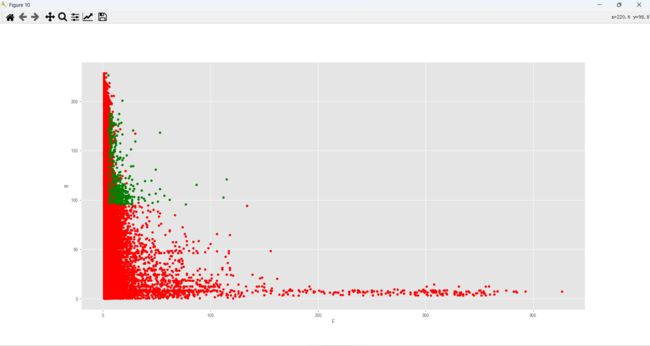
用户消费次数、消费金额散点图
用户消费金额分布图
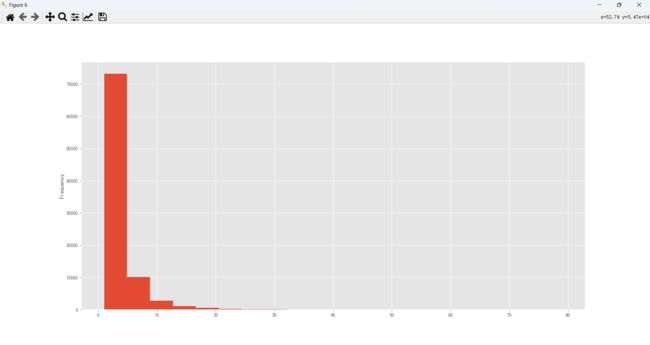
用户消费次数分布图
用户累计消费金额占比

根据用户分组计数后的描述性统计结果,共有89195位客户.结合上图,可知: 50%客户仅贡献了约10%的消费金额;8万名累计消费总额占比仍未超过一半,累计占比约为45%。
用户消费行为
用户第一次消费

用户第一次购买集中在4月份,之后4月末出现剧烈波动,骤然下滑。
7至9月,新客每天稳步增长;10月,11月两月新客较少;整体新客数量呈现下滑趋势。
用户最后一次消费
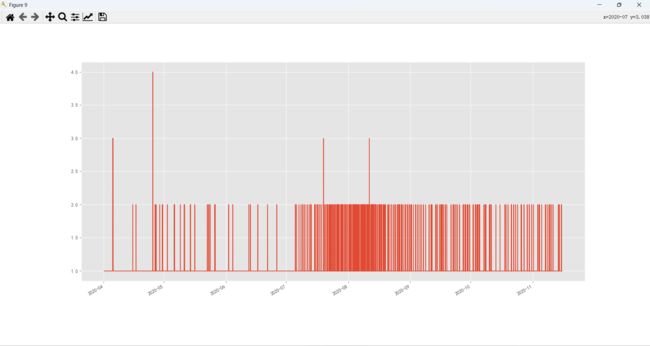
用户最后一次购买集中在7月中旬至9月中旬,4月至7月客户流失较少。
新老客消费占比
user_life=df_user.event_time.agg(['min','max'])
user_life.head()
(user_life['min']==user_life['max']).value_counts()
用户分层(RFM)
rfm=df_["2020-04":"2020-11"].pivot_table(index='user_id'
                         ,values=['price','event_type','event_time']
                         ,aggfunc={'price':'sum','event_type':'count','event_time':'max'}
                                        )
rfm.head()
rfm['R']=-(rfm.event_time-rfm.event_time.max())/np.timedelta64(1,'D')
rfm.head()
rfm.rename(columns={'event_type':'F','price':'M'},inplace=True)
rfm['label'] = rfm[['R','F','M']].apply(lambda x:x-x.mean()).apply(rfm_func,axis=1)
rfm
rfm.groupby('label').agg(['sum','mean','count'])
- 重要客户平均购买频次低于一般客户,但重要客户平均消费远超为一般客户人均消费;
- 重要客户总数为一半客户1/3,但重要客户消费金额约为一般客户的10倍;
- 重要客户平均购买频次低于一般客户;
- 在最近一次购买时期上,重要客户同一般客户没有明显区别;
rfm.head()
用户生命周期(第一次和最后一次)
用户周期描述
((user_life['max']-user_life['min'])/np.timedelta64(1,'D')).describe()


