prometheus监控 grafana可视化工具
-
- 安装prometheus
- 配置node_exporter监控项
- 配置mysql-exporter监控项
- 可视化工具Grafana
安装prometheus
#下载安装包
[root@prometheus ~]#  wget https://github.com/prometheus/prometheus/releases/download/v2.47.2/prometheus-2.47.2.linux-amd64.tar.gz
[root@prometheus ~]# tar -xf prometheus-2.47.2.linux-amd64.tar.gz -C /usr/local
[root@prometheus ~]# cd /usr/local
[root@prometheus local]# mv prometheus-2.47.2.linux-amd64/ prometheus
[root@prometheus local]# cd prometheus/
[root@prometheus prometheus]# ./prometheus --version
prometheus, version 2.47.2 (branch: HEAD, revision: 3f3172cde1ee37f1c7b3a5f3d9b031190509b3ad)
  build user:       root@79f2ad339b75
  build date:       20231012-16:07:10
  go version:       go1.21.3
  platform:         linux/amd64
  tags:             netgo,builtinassets,stringlabels
[root@prometheus prometheus]# ./prometheus --config.file=prometheus.yml
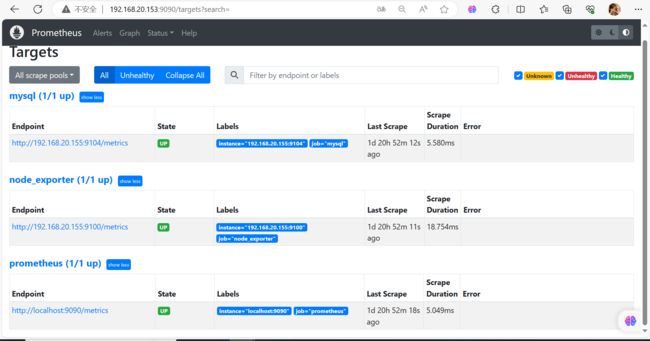
[root@prometheus ~]# ss -nplt
State Recv-Q Send-Q Local Address:Port Peer Address:Port
LISTEN 0 128 *:22 *:* users:(("sshd",pid=939,fd=3))
LISTEN 0 100 127.0.0.1:25 *:* users:(("master",pid=1148,fd=13))
LISTEN 0 128 [::]:9090 [::]:* users:(("prometheus",pid=1550,fd=7))
LISTEN 0 128 [::]:22 [::]:* users:(("sshd",pid=939,fd=4))
LISTEN 0 100 [::1]:25 [::]:* users:(("master",pid=1148,fd=14))
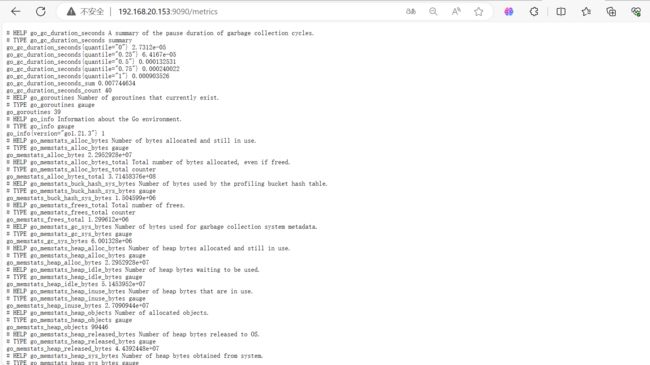
查看暴露指标http://192.168.20.153:9090/metrics
将Prometheus配置为systemd管理
[root@prometheus ~]# vim /usr/lib/systemd/system/prometheus.service

[root@prometheus ~]# systemctl daemon-reload
[root@prometheus ~]# systemctl start prometheus
[root@prometheus ~]# ss -tlanp |grep 9090
LISTEN     0      128       [::]:9090                  [::]:*                   users:(("prometheus",pid=1550,fd=7))
ESTAB      0      0        [::1]:57360                [::1]:9090                users:(("prometheus",pid=1550,fd=11))
ESTAB      0      0        [::1]:9090                 [::1]:57360               users:(("prometheus",pid=1550,fd=12))
ESTAB      0      0      [::ffff:192.168.20.153]:9090                 [::ffff:192.168.20.1]:63447               users:(("prometheus",pid=1550,fd=13))
ESTAB      0      0      [::ffff:192.168.20.153]:9090                 [::ffff:192.168.20.1]:63451               users:(("prometheus",pid=1550,fd=15))
ESTAB      0      0      [::ffff:192.168.20.153]:9090                 [::ffff:192.168.20.1]:63449               users:(("prometheus",pid=1550,fd=14))
配置node_exporter监控项
客户端,配置服务发现监控linux主机及相关服务
[root@localhost ~]# wget https://github.com/prometheus/node_exporter/releases/download/v1.7.0/node_exporter-1.7.0.linux-amd64.tar.gz
[root@localhost ~]# tar -xf node_exporter-1.7.0.linux-amd64.tar.gz -C /usr/local/
[root@localhost ~]# cd /usr/local
[root@localhost local]# mv node_exporter-1.7.0.linux-amd64/ node
[root@localhost local]# cd node
[root@localhost node]# ./node_exporter &
[root@localhost node]# ss -tlnp  | grep 9100
LISTEN     0      128       [::]:9100                  [::]:*                   users:(("node_exporter",pid=1515,fd=3))
[root@localhost node]# vim /usr/lib/systemd/system/node_exporter.service
[Unit]
Description=node_exporter
After=network.target

[Service]
ExecStart=/usr/local/node_exporter/node_exporter
Restart=on-failure

[Install]
WantedBy=multi-user.target
[root@localhost node]# systemctl daemon-reload
[root@localhost node]# systemctl start node_exporter
[root@localhost node]# ss -tlnp  | grep 9100
LISTEN     0      128       [::]:9100                  [::]:*                   users:(("node_exporter",pid=11178,fd=3))
[root@prometheus prometheus]# vim prome
theus.yml
 - targets: ["localhost:9090"]
  - job_name: "node"
    static_configs:
      - targets: ["192.168.20.155:9100']
# 重启服务
[root@prometheus prometheus]# systemctl restart prometheus

配置mysql-exporter监控项
# 安装mysqld-exporter
[root@localhost ~]# wget https://github.com/prometheus/mysqld_exporter/releases/download/v0.15.0/mysqld_exporter-0.15.0.linux-amd64.tar.gz
[root@localhost ~]# tar xf mysqld_exporter-0.15.0.linux-amd64.tar.gz -C /usr/local/
[root@localhost local]# mv mysqld_exporter-0.15.0.linux-amd64 mysqld_exporter
[root@localhost mysqld_exporter]# vim .my.cnf
[client]
user=root
password=Qianfeng@123
启动mysqld-exporter
[root@localhost mysqld_exporter]# ./mysqld_exporter --config.my-cnf="/usr/local/mysqld_exporter/.my.cnf" &
[root@localhost mysqld_exporter]# ps -ef |grep mysqld_exporter
root       3447   3398  0 01:31 pts/1    00:00:02 ./node_exporter
root       4647   3398  0 02:13 pts/1    00:00:00 ./mysqld_exporter --config.my-cnf=/usr/local/mysqld_exporter/.my.cnf

[root@localhost mysqld_exporter]# ss -lntp |grep 4647
LISTEN     0      128         :::9104                    :::*                   users:(("mysqld_exporter",pid=4647,fd=
普罗米修斯服务端配置文件添加监控项
[root@prometheus prometheus]# vim prometheus.yml
  - job_name: 'mysql'
    static_configs:
    - targets: ['192.168.2.44:9104']

[root@prometheus prometheus]# systemctl restart prometheus
node_memory_MemTotal_bytes{job="node_exporter", instance="192.168.20.155:9100"}
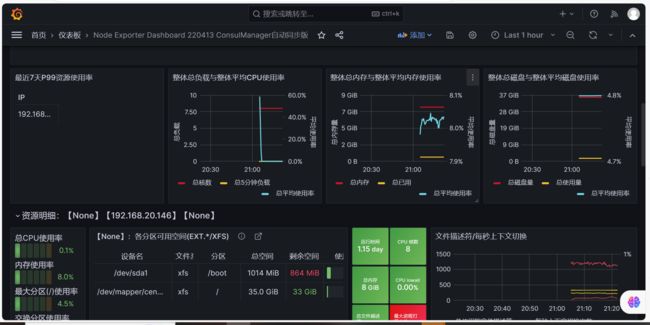
可视化工具Grafana
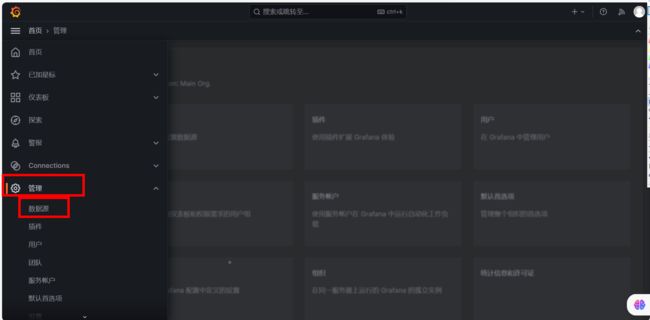
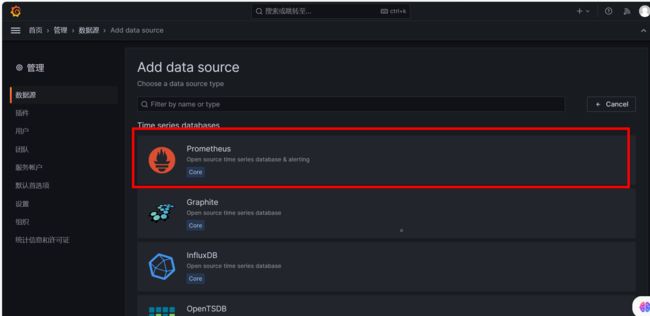
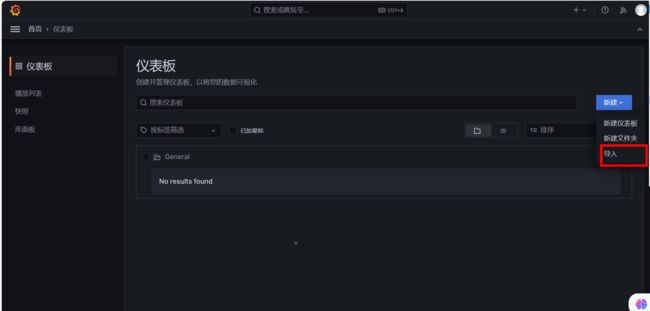
使用Grafana展示Prometheus 数据
[root@prometheus ~]# wget https://mirrors.tuna.tsinghua.edu.cn/grafana/yum/rpm/Packages/grafana-10.0.0-1.x86_64.rpm
[root@prometheus ~]# yum install initscripts fontconfig -y
[root@prometheus ~]# yum install -y grafana-10.0.0-1.x86_64.rpm
[root@prometheus ~]# systemctl status grafana-server.service
[root@prometheus ~]# ss -tlanp |grep grafana |grep LISTEN
LISTEN     0      1024      [::]:3000                  [::]:*                   users:(("grafana",pid=10629,fd=11))
启动后访问地址:ip:3000
初始用户名和密码都是admin

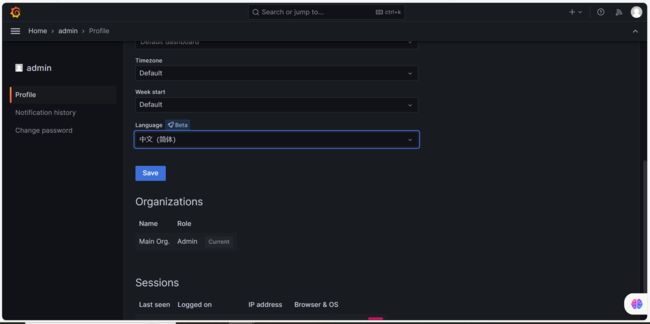
更改密码

主页面

改为中文